Gold and Silver Sector Big Green Light and Low Risk Entry Setup...
Commodities / Gold and Silver 2015 Nov 23, 2015 - 03:43 AM GMTBy: Clive_Maund
-
 Have the problems exposed by the financial crisis of 2008 been addressed and dealt with to any extent? - no they have not, they have been papered over by creating more debt and printing money, thus making the underlying problems much worse.
 -
Has debt shrunk since 2008? - no, it has exploded.
-
Has the money supply contracted since 2008? - no, it has expanded massively.
-
Has the derivatives pyramid been reduced in magnitude since 2008? - no it has continued to compound.
-
Has the global economy grown sufficiently in the years since 2008 to more than cover the extra load imposed by the growth in the factors listed above? No, it has not, all it is has done is limp along, lamed by debt.
Logically, one would expect massive expansion or growth in the factors listed above to be bullish for gold and silver, which should hold their value in real terms, and many PM sector investors banking on such logic have as we know been ruined, so why have gold and silver dropped for 4 years now?
The reason is that they have been abandoned by hot money pursuing speculative bubbles that, on opportunity cost grounds, have proved to be more fertile territory for amassing speculative gains than gold and silver. Given that the underlying bullish factors for gold and money have not disappeared over the past 4 years, and on the contrary have actually intensified, it should be clear that what has been labeled a bearmarket in gold and silver is actually a gigantic correction within an ongoing epochal bullmarket. Furthermore, this deduction implies that once the speculative bubbles that have attracted hot money in recent years burst, it is likely to come flooding back into the PM sector in a big way, which will have huge upside potential because the factors that drove the big gold and silver bullmarket have not gone away and have continued to operate in the background.
The areas that have attracted Hot Money in the recent past are the bondmarkets, the broad stockmarket, especially sectors such as Biotech and Tech stocks, and the property market, all driven by an abundance of cheap debt and the carry trade, which look set to dry up soon with the Junk Bond market teetering on the verge of collapse, a development that will spike interest rates and lead to these bubbles bursting at terrifying speed. When that happens - and we may not be too far from this development - gold and silver will soar. The assertion that gold and silver will drop when interest rates rise because they pay no interest is nonsense that has no basis in reality - gold and silver soared in the late 70's along with interest rates.
While gold and silver have dropped a lot in the past years, Precious Metals stocks have been devastated, losing most of their value and dropping to extremely low levels out of all proportion to the losses in the metals themselves. What this means is that once gold and silver turn up again, there is scope for a massive recovery in this sector, especially as many mining companies have "pulled in their sails" and put their houses in order, so that they are profitable even at current metals prices, so if gold and silver do rise, many mining companies are in position to reap windfall profits.
As speculators we know that in practical terms it is better to buy something that is overvalued but keeps on appreciating, than something that is undervalued that keeps on dropping in price. This is why so many value investors long the PM sector have been "taken to the cleaners" in the recent past. Their more pragmatic peers profiting from various bubbles have been able to mock them with the jeering aside "If you're so smart, why ain't you rich?" This is why we have striven to avoid falling into the trap of "being right too soon", and even successfully shorted the PM sector in recent weeks, in full knowledge of its undervalued status. The reason that we did this was that Big Money, who we track via the COTs, were heavily short, and we are not going to go against them.
We have been in the situation in the recent past of knowing that the Precious Metals sector is monstrously undervalued, but also knowing that Big Money was betting on another drop in the sector. That has now changed very significantly in that we have had another sizeable drop, which has been accompanied by a quite dramatic change in Big Money orientation - much more than we would expect for such a move, so much so that while there is seemingly some more downside potential in silver, gold's decline looks to have already just about run its course - it looks ready to turn up soon, and if so it means that silver probably will too, and PM stocks, which are incredibly undervalued relative to gold, are likely to take off strongly higher soon from their current depressed levels.
We will now review the evidence on the charts that makes a compelling case to moving into the sector now.
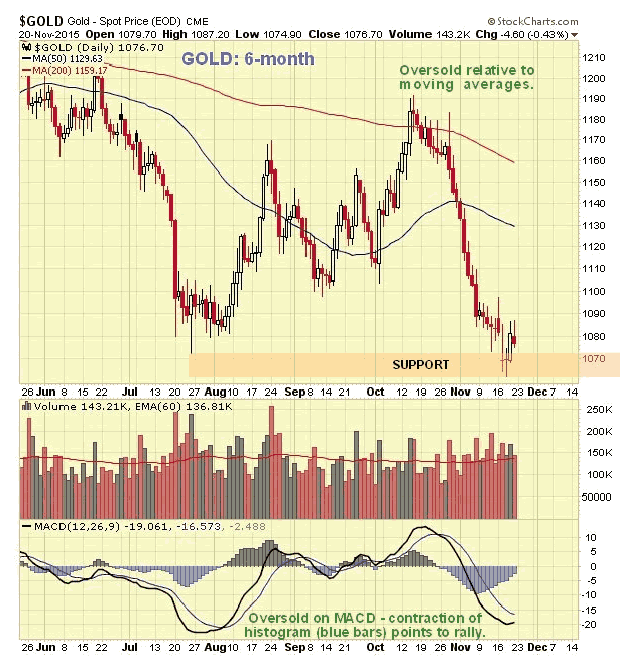
We start with the latest 6-month chart for gold, on which we see that it has suffered a substantial drop from the middle of last month, but it is now considered likely that it hit bottom last Tuesday - Wednesday, and is forming an intermediate bottom here, meaning that it should turn up again soon. On this chart we can also see that it is oversold on its MACD indicator and relative to its moving averages.
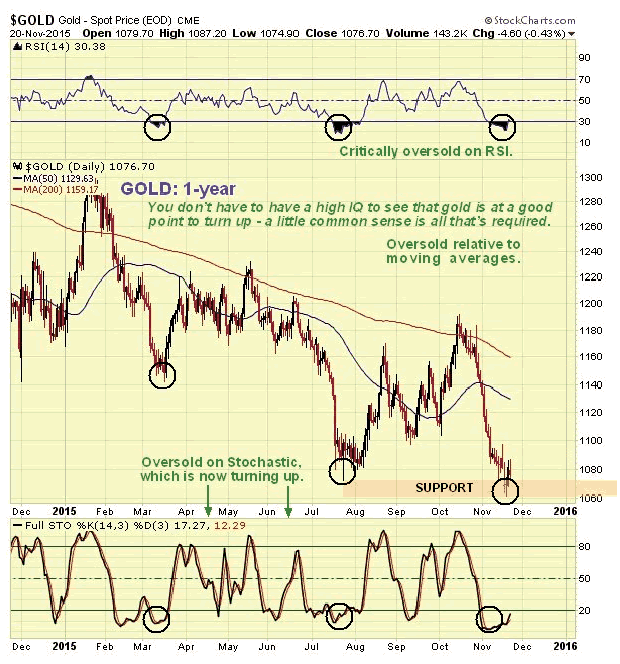
The 1-year chart provides some more perspective, and on this chart we can also see that gold has been critically oversold for most of this month on its RSI indicator, which increases the probability that it is basing, and also that its Stochastics indicator is turning up after a period at a very low level, which commonly leads to a rally.
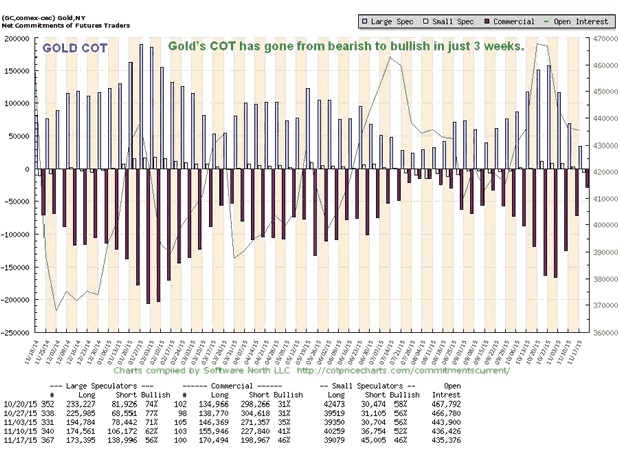
Thus it is more than a little interesting to observe on the latest COT chart for gold that the Commercials have been unloading their short positions at a very rapid clip in recent weeks, so much so that they have all but evaporated. This is viewed as a very bullish development indeed. We could not boldly take positions in the sector without this happening first. Just a few short weeks ago the COT structure for gold was terribly bearish, and for silver it was even worse, which is why we went short. Now we see that the coast is clear for us to go long the sector with confidence, and as we will see on the charts for GDX shown below, the proximity of strong support means that we can set fairly tight stops to get us out for a modest loss in the event that prices break lower again.
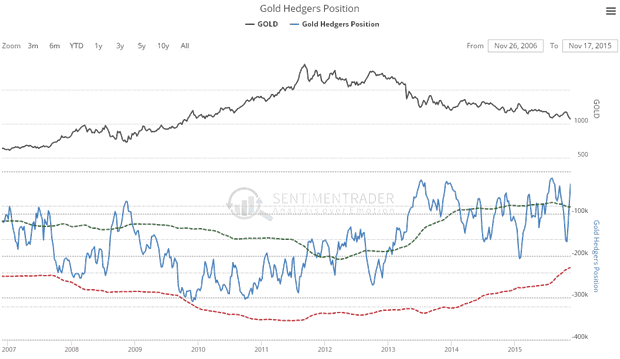
The gold Hedgers chart shown below, which is a form of COT chart, goes back years and thus gives us more perspective. On it we can see that Hedgers' positions are very close to the bullish peaks of recent years, and while these earlier peaks didn't stop gold from eventually falling a little more, gold is considered to be at a good point to turn up here, or very soon, for other reasons. It is worth noting that Hedgers' positions are considerably more bullish now than they were at the 2008 crash trough, which preceded a really big upleg.
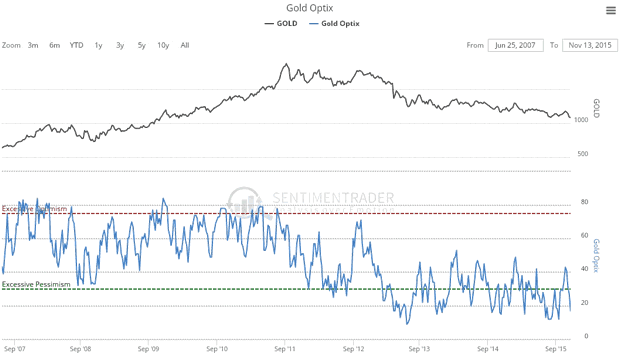
The latest Gold Optix or Optimism chart shows an extreme level of pessimism that calls for some sort of rally soon even if only a temporary one. Again, such low levels over the past two years or so have not brought about the end of the downtrend - but no downtrend lasts for ever.
Now it's laugh or cry time with this pair of trend power indicators. The observation here is that it can't get any worse, and you know what? - when things get this bad, oftentimes we see a sudden turn for the better.
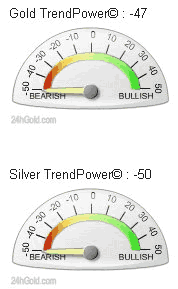
Trend power indicators courtesy of www.24hgold.com
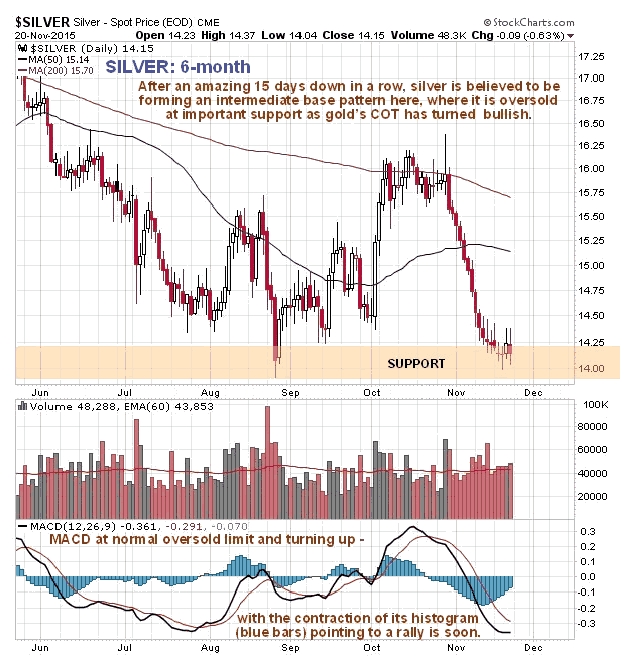
Now we turn to silver, where we see on its latest 6-month chart that it is probably forming an intermediate base, after the persistent decline of recent weeks has brought it down to the support level near to its August lows. Its MACD indicator is at its normal oversold limit and it is substantially oversold relative to its moving averages. The contraction of its MACD histogram (blue bars) points to the growing probability of a rally soon.
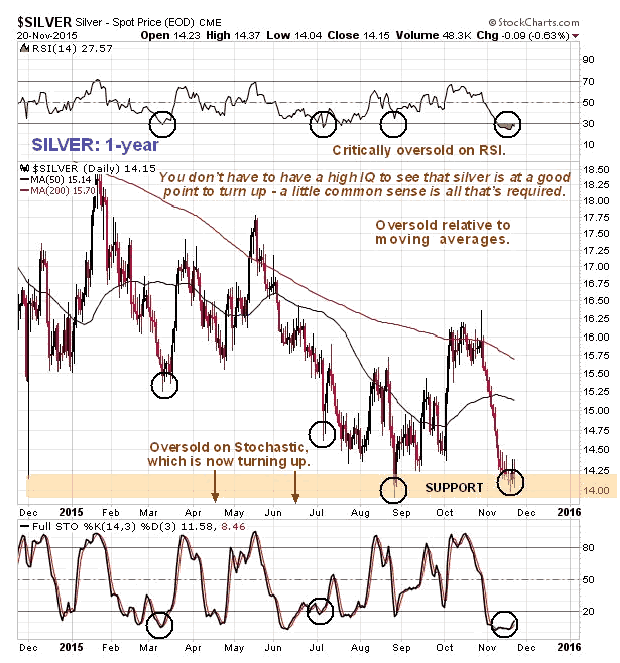
Zooming out somewhat via the 1-year chart, we see that the support at the August lows is given added significance by the fact that silver also bottomed at about this level back last November - December when it spiked down to it intraday. On this chart we also see that silver is critically oversold on its RSI, and heavily oversold on its Stochastic, which is now turning up, suggesting that a rally is imminent.
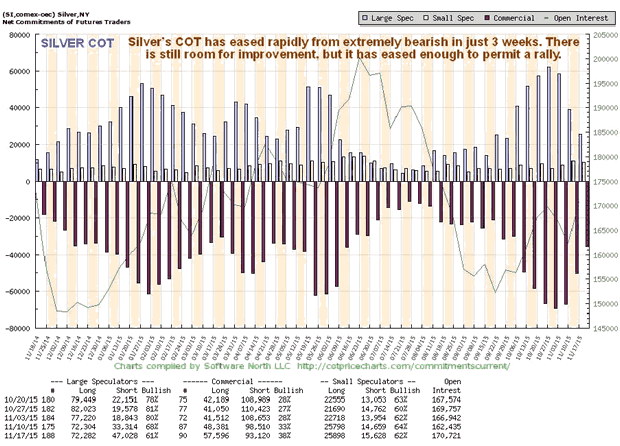
While there is still room for improvement on silver's COT, we see that it is improving fast, and the fact that gold's COT is already bullish, and PM stocks are trading at ridiculously low levels, means that we should no longer hold back on moving into the sector. Even if we are not at the bottom, we are likely very close to it, and here we should note that gold is likely to lead other commodities out of the deep slump.
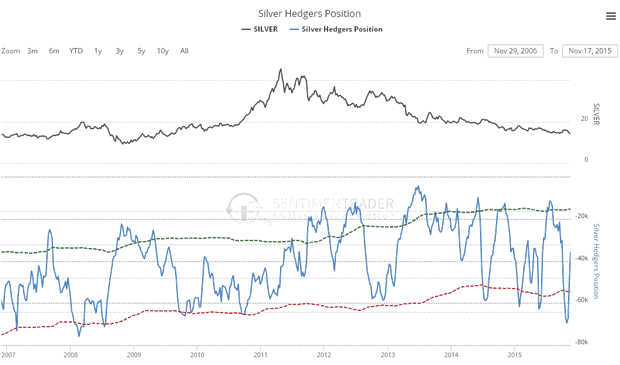
The silver Hedgers chart shows readings in middling ground. Whilst this might otherwise lead us to hold back for a little while longer, the now bullish gold COT coupled with the fact that silver looks like it is forming some kind of bottom, leads us to conclude that this is the time to go ahead and buy silver related investments now, and as mentioned above, the risk/reward is highly favorable, because due to the proximity of strong support, we can place close stops.
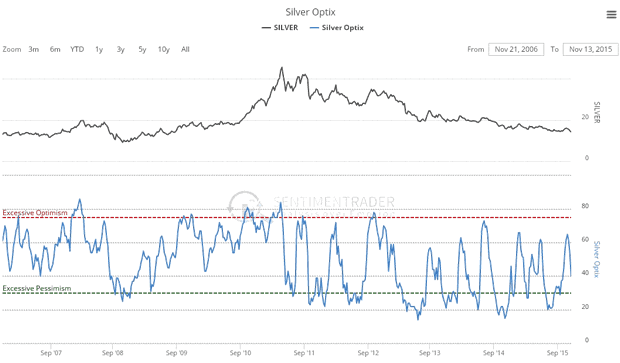
It's a similar situation with the silver Optix, or Optimism chart, where readings could be better but it is not considered to be worth waiting for them to improve.
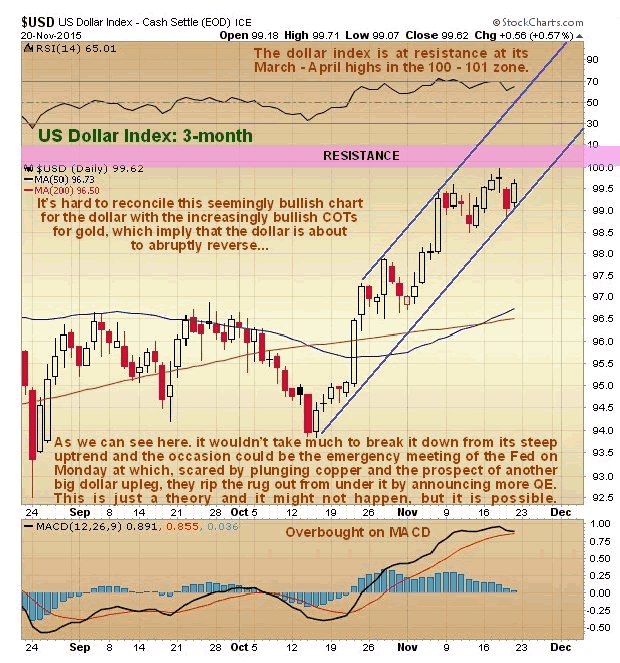
If gold and silver are set to turn up, it implies that the dollar is peaking, so what's going on? Copper is on the verge of freefall, which has dangerous implications for the economy, and if the Fed doesn't do something soon the dollar index will likely head to the 120 area which will have catastrophic consequences. They have called an emergency meeting for Monday, so it is possible that they are going to pull some rabbit out of the hat then, such as announcing another round of QE. If they do it will rip the rug out from under the dollar - this could be what the Commercials are anticipating.
On the latest 3-month chart for the US dollar index, we can see that it is at the lower boundary of its uptrend channel, so it is possible that it could break sharply lower after the Fed on Monday.
Copper's latest 6-month chart shows how it is falling steeply and appears to be accelerating away to the downside.
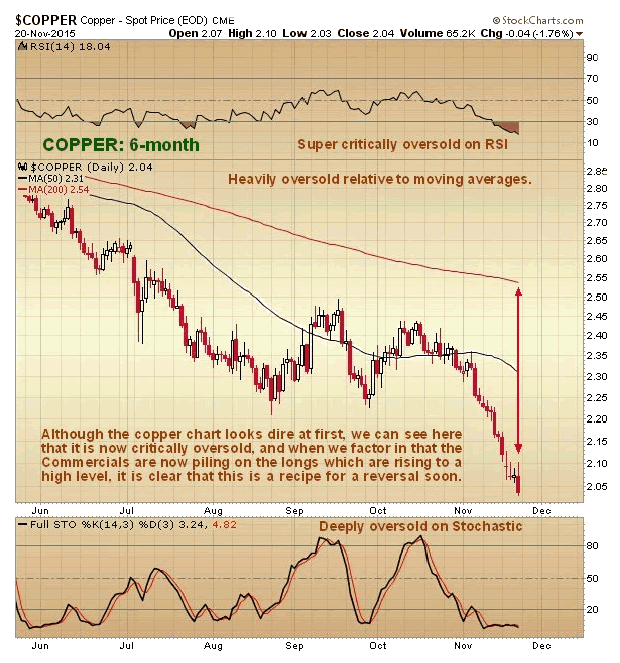
Thus it is very interesting to observe on the latest copper COT chart that the Commercials are piling on the longs - this suggests a reversal soon.
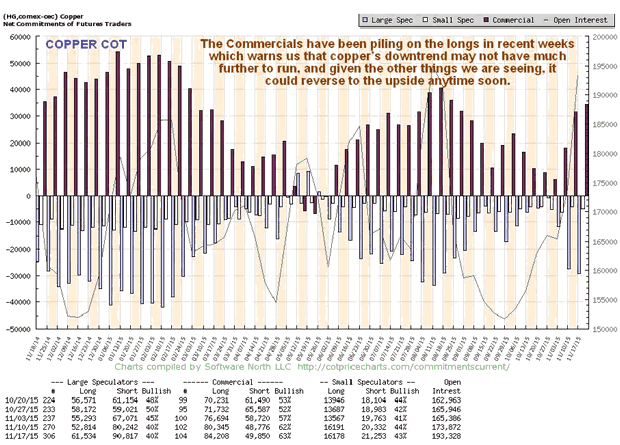
If copper rallies, gold and silver will rally too. If so, it means the dollar will drop. The dollar will drop if the Fed does something on Monday, like announce a surprise QE. This looks possible - because they are cornered in a very difficult situation, their actions are less predictable. The conclusion therefore is that we should not be backward in coming forward and buying PM sector investments across the board on Monday, BEFORE they make their statements, setting appropriate stops. Even if we are wrong on this, everything we have reviewed here suggests that we are not far from a PM sector bottom.
Now we will look at tactical considerations using charts for the GDX. It is understood that many investors or would be investors in this sector are feeling sheepish and wary - "What if it drops again?" they cry. This is perfectly understandable after years of heavy losses. However, there comes a time when you have to "put your best foot forward" otherwise you will never do anything. The three reasons that the sector is so attractive here are the massive undervaluation of Precious Metals stocks relative to bullion, made plain in Friday's update The Extreme Undervaluation of Big Gold Stocks , the now favorable COTs for gold (and even copper), and the fact that an exceptionally favorable risk/reward ratio exists at this time, as we will now see on the charts for GDX.
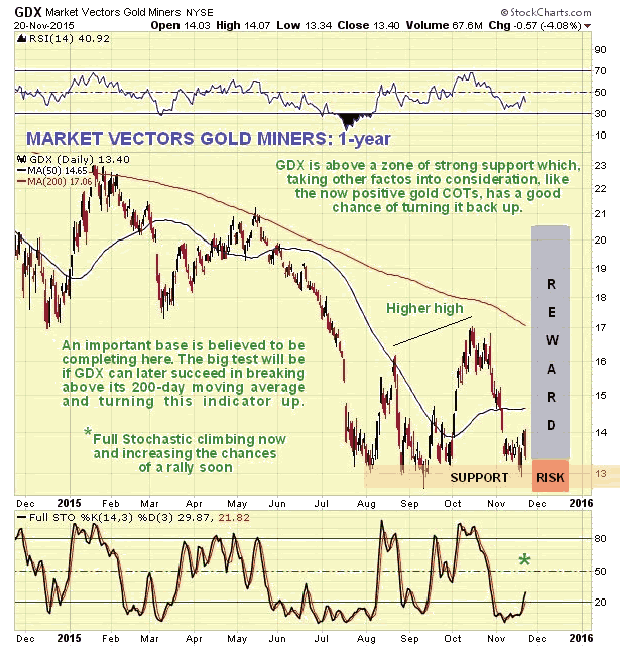
On the 1-year chart for GDX we can see how a potential base pattern has formed following another brutal decline into July of this year, with a strong support level forming at its lower boundary. GDX has rallied sharply off this support twice already, with the higher high on the 2nd rally a positive sign. Now it is back down at this support again and looks like it basing just above it again in readiness for another rally soon, and the proximity of this support is presenting us with a low risk entry point, because stops can be set below the support.
It is vital to understand that the risk/reward ratio is exceptionally favorable here, especially for longer-term investors - upside is unlimited, much more than is shown on the chart, while downside is limited by where you set your stops, which in any event will be fairly close. What about the risk of it breaking lower and making another big step down? - so what? - if it does you allow yourself to get stopped out for a relatively modest loss, and then either buy again later when the drop looks to have run its course, or buy back if it reverses back clear above the support. What about Big Money running stops and then mopping up your holdings on the cheap by forcing a brief new low, like they did in September? While you can never entirely escape this risk, the way to handle it is to be a bit more generous in setting stops, by placing them a little below where most other traders would put them, and never at a round number, where they tend to be clustered. If they manage to shake you out, you have to bit the bullet and buy back on the price rising back above the support. Note here that you can use GDX as a general guide for all positions in the sector.
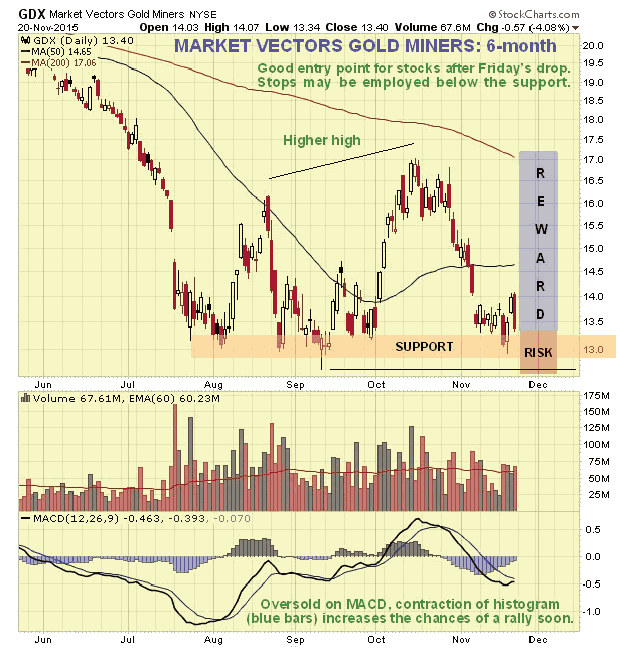
On the 6-month chart for GDX we can see that Friday's quite sharp drop has presented us with a better entry point with a more favorable risk/reward ratio. The contraction of the MACD histogram (blue bars) makes a rally likely soon.
We will be looking at a list of leveraged ETFs and PM stocks that are worth going for on the site a little later.
By Clive Maund
CliveMaund.com
For billing & subscription questions: subscriptions@clivemaund.com
© 2015 Clive Maund - The above represents the opinion and analysis of Mr. Maund, based on data available to him, at the time of writing. Mr. Maunds opinions are his own, and are not a recommendation or an offer to buy or sell securities. No responsibility can be accepted for losses that may result as a consequence of trading on the basis of this analysis.
Mr. Maund is an independent analyst who receives no compensation of any kind from any groups, individuals or corporations mentioned in his reports. As trading and investing in any financial markets may involve serious risk of loss, Mr. Maund recommends that you consult with a qualified investment advisor, one licensed by appropriate regulatory agencies in your legal jurisdiction and do your own due diligence and research when making any kind of a transaction with financial ramifications.
Clive Maund Archive |
© 2005-2022 http://www.MarketOracle.co.uk - The Market Oracle is a FREE Daily Financial Markets Analysis & Forecasting online publication.


