


Market Traders and Trendlines: A Match Made in Opportunity Heaven
InvestorEducation / Learn to Trade Dec 03, 2015 - 04:13 PM GMTBy: EWI

See why this simple tool helps identify high-probability trade set-ups in real world markets
It's the start of the winter holidays -- which, if your family is anything like mine, is also the beginning of a long tradition of deeply regrettable line-crossing, i.e.:
- Crossing that line into interrogating "new" dinner guests as to why they are still single
- Crossing that line into inviting your recently divorced sister-in-law to "stay as long as" she needs
- Crossing that line into a third (no, let's be honest) fourth helping of pecan pie
In these cases, crossing "the line" is the first step down a proverbial mine field of emotional and physical discomfort. And there's no going back!
But in the world of technical analysis of financial markets, crossing one kind of line is often the first step to identifying a high-confidence trade set-up. The line I'm talking about is the trendline.
Trendlines are exactly what they sound like -- lines that identify the dominant price trend of a particular market. Simply put, they connects two points, usually price highs or price lows. And, as our chief commodities analyst Jeffrey Kennedy explains, "trendlines are one of the simplest and most effective tools a trader or analyst can employ."
In order to see why, here are two real-world examples of major market reversals forecast by Jeffrey Kennedy with the help of trendlines.
-- Gold --
In the November 2010 of our Monthly Commodity Junctures, Jeffrey employed a rare trendline timing technique to calculate the next likely turning point in gold's future:
"As always, we begin with a 1-2 trendline and a parallel of that line against point 3. Next, we connect points 3 and 2 to identify that line's midpoint 4. The timeline begins at point 1, February 5, and moves through point 4 to cross the trendline drawn from point 3 on December 6.
How do we use this information? For starters, we mark this date on our calendars and watch and wait."
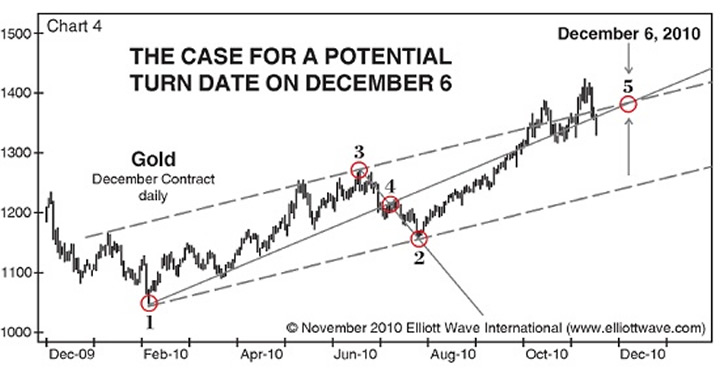
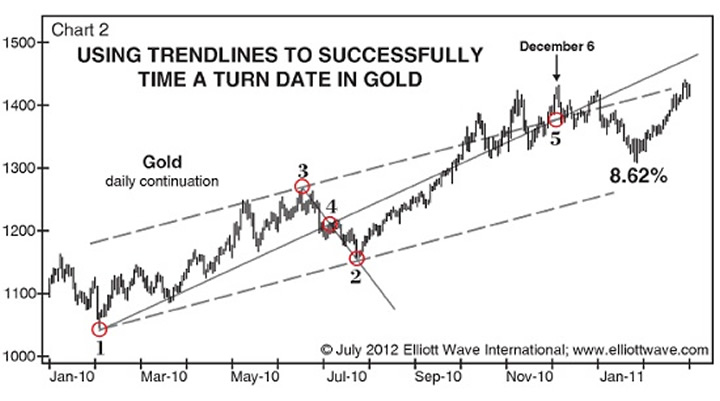
So, how did this timing technique pan out? Well, the next chart shows you exactly what happened: Gold hit $1431.10 per ounce, the high of the year in 2010 on December 7, missing the forecasted market turn by a single day. In the weeks that followed, gold fell 8.6%."
-- Orange Juice --
In the May 3, 2011 Daily Commodity Junctures, Jeffrey set the bullish stage in orange juice after prices broke through a specific trendline:
"Prices have penetrated critical trendline resistance on a daily closing basis. As you know, I am a huge advocate of trendlines, as well as daily closing price action. In other words, today's events are significant in the fact that it signals a resumption of the larger uptrend and clears the way for higher prices beyond this year's high of 179.30."
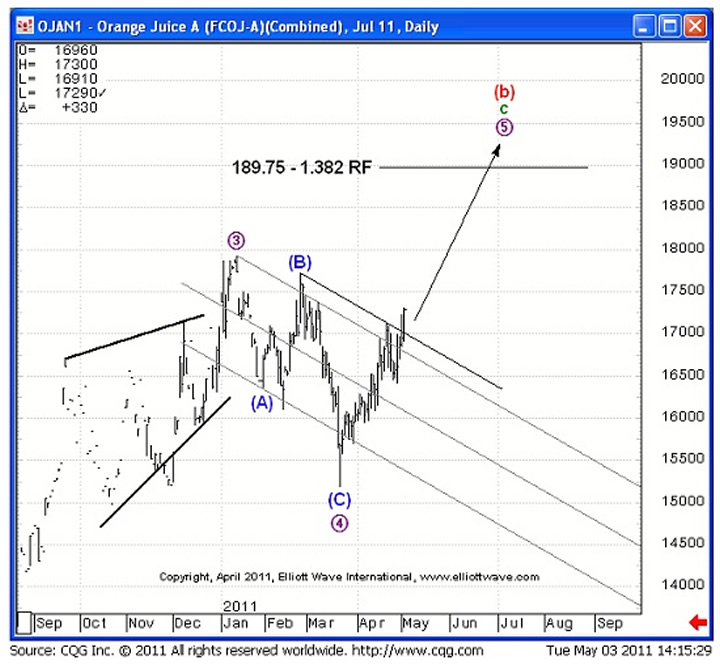
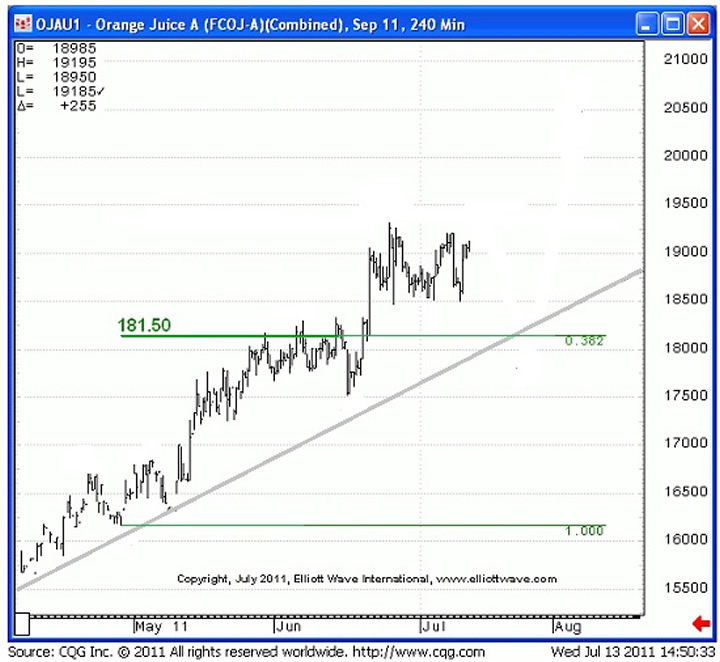
From there, O.J.'s uptrend went into full swing, with prices soaring well above the year's high as Jeffery anticipated:
The truth is, no technical tool works alone -- and that includes trendlines. In the world of market forecasting, there is no magic all-purpose measure.
But what we can say is this: Trendlines -- used in conjunction with the Wave Principle and other tools like MACD or RSI -- is the mark of a truly complete technical toolbox.
And here's the best part: Jeffrey Kennedy is such a huge advocate of trendlines that he wrote a book about them -- a free 14-page eBook that is, titled
"Trading the Line: Five Ways You Can Use Trendlines to Improve Your Trading"
Want to learn how to draw your own trendlines -- and gain an advantage you've never had before?
"Trading the Line" -- Jeffrey's 14-page eBook -- is available now, for FREE! Simply sign up today to join our 300,000-plus member free Club EWI community and get instant access to this exclusive trader resource.
Log in now to read your free eBook
Need a login? Complete your free Club EWI profile and get instant access
This article was syndicated by Elliott Wave International and was originally published under the headline Traders and Trendlines: A Match Made in Opportunity Heaven. EWI is the world's largest market forecasting firm. Its staff of full-time analysts led by Chartered Market Technician Robert Prechter provides 24-hour-a-day market analysis to institutional and private investors around the world.
About the Publisher, Elliott Wave International
Founded in 1979 by Robert R. Prechter Jr., Elliott Wave International (EWI) is the world's largest market forecasting firm. Its staff of full-time analysts provides 24-hour-a-day market analysis to institutional and private investors around the world.
© 2005-2022 http://www.MarketOracle.co.uk - The Market Oracle is a FREE Daily Financial Markets Analysis & Forecasting online publication.