


US Dollar Index Technical Outlook
Currencies / US Dollar Dec 04, 2015 - 05:00 PM GMTBy: Austin_Galt

 The US Dollar index has made marginal new highs which I believe will turn out to be a false break top. Let's take a top down approach beginning with the monthly chart.
US Dollar Index Monthly Chart
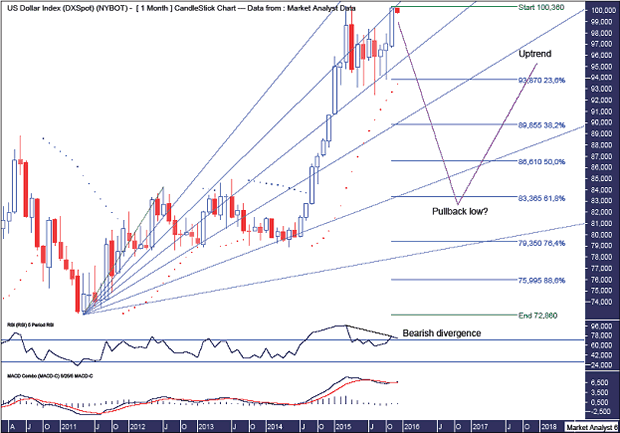
Today price has traded marginally above the November high and I am looking for the month of December to show a bearish outside reversal candle. A tall order one may think given the big bullish November candle. Time will tell.
The PSAR indicator is still bullish with the dots at 93.45. Breaking that level will confirm a multi month correction is at hand.
The Fibonacci Fan shows some nice symmetry with price. The recent low was at support from the 38.2% angle with price rallying back to the 23.6% angle. I expect resistance to come in here and turn price back down.
I have added Fibonacci retracement levels of the recent major move up and I am still targeting price to clip the 61.8% level to put in the final pullback low.
The RSI shows a bearish divergence at this high. After the pullback I expect price to trade to new highs and potentially put in a triple bearish divergence. All in good time.
The MACD indicator is actually marginally bullish but below the recent high. It looks to be waiting for an order on which direction to take next. I favour down.
US Dollar Index Weekly Chart
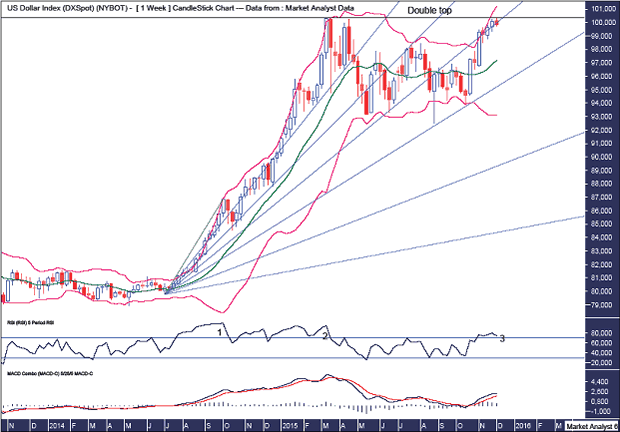
We can see this high, if indeed price does turn down from here, sets up a big double top. This double top is against the trend so after a big reaction down price should then come back up and bust to new highs.
The Bollinger Bands show price bouncing up and down between the bands which is consistent with a consolidation or trend change. I favour the latter.
The Fibonacci Fan shows price making its way through the angles. The most recent low was at support from the 61.8% angle and this last gasp rally looks to be struggling to overcome the 50% angle. If a high forms now then price should trade back down and take out the 61.8% angle in short order.
The RSI shows a triple bearish divergence at this new price high.
The MACD indicator is still bullish but the averages appear to be curling over.
US Dollar Index Daily Chart
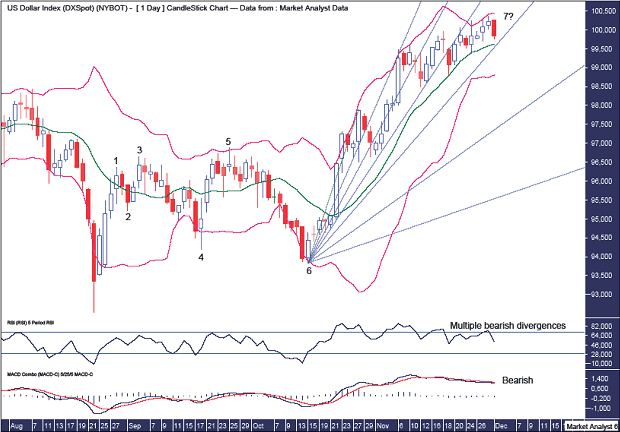
We can see this high is expected to be the final point 7 high in a very bearish 7 point broadening top. Also, as shown in previous analysis, this is also a point 4 and point 5 high in larger formations.
The Bollinger Bands show price crawling higher between the middle and upper bands. If my analysis is correct and a top is at hand then the next move down should be impulsive and see price get back down to the lower band pretty quick smart.
The Fibonacci Fan shows price making its way through the angles and then next support angle is the 61.8% angle with a big drop thereafter to the 76.4%. Might be time to hold on to your hats!
The RSI shows multiple bearish divergences forming at this new price high.
The MACD indicator is bearish with multiple bearish divergences as well.
Summing up, the expectation of a multi month move down remains unchanged and I believe that move to be imminent.
By Austin Galt
Austin Galt is The Voodoo Analyst. I have studied charts for over 20 years and am currently a private trader. Several years ago I worked as a licensed advisor with a well known Australian stock broker. While there was an abundance of fundamental analysts, there seemed to be a dearth of technical analysts. My aim here is to provide my view of technical analysis that is both intriguing and misunderstood by many. I like to refer to it as the black magic of stock market analysis.
Email - info@thevoodooanalyst.com
© 2015 Copyright The Voodoo Analyst - All Rights Reserved
Disclaimer: The above is a matter of opinion provided for general information purposes only and is not intended as investment advice. Information and analysis above are derived from sources and utilising methods believed to be reliable, but we cannot accept responsibility for any losses you may incur as a result of this analysis. Individuals should consult with their personal financial advisors.
Austin Galt Archive |
© 2005-2022 http://www.MarketOracle.co.uk - The Market Oracle is a FREE Daily Financial Markets Analysis & Forecasting online publication.