


U.S. Interest Rates Yield Curve Flattening Further, Why it Matters
Interest-Rates / US Interest Rates Dec 20, 2015 - 09:00 PM GMTBy: Dan_Norcini

 I am becoming increasingly concerned over the flattening yield curve. This curve enables us to get a first hand view of sentiment towards economic growth among bond investors and other large players in the interest rate markets, some of whom are among the most sophisticated observers of the financial scene anywhere.
Ten Year - Two Year Spread
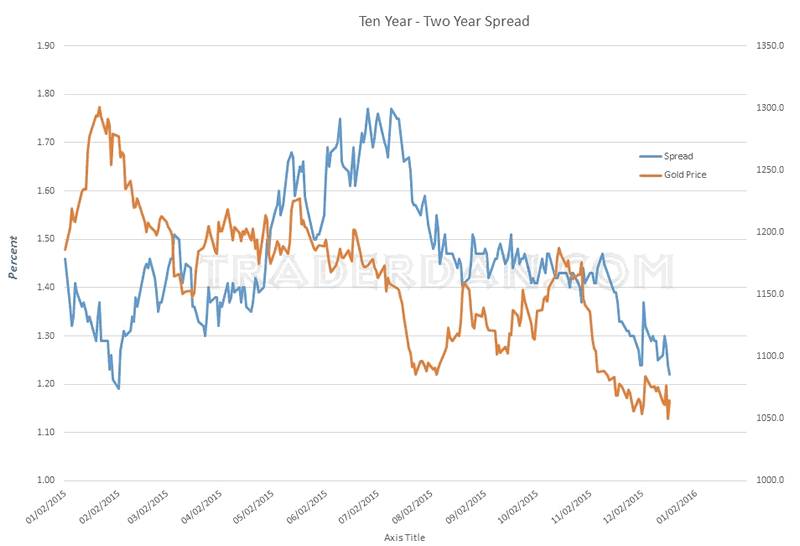
It is interesting that in the last six weeks, the spread between the Ten Year and the Two year treasuries has flattened exactly 25 basis points, which just so happens to be the same amount that the Fed just moved the Fed Funds target rate this past Wednesday.
There are several things that I believe are behind this tightening of the curve. Firstly, investors are STARVED FOR YIELD.
While the Fed has finally, after seven years, moved short term rates higher, it remains a fact that for investors looking to generate yield on invested capital, rates remain abysmally low. That is forcing them to go further and further out along the curve ( towards the long end) in an attempt to secure a better return. I wish for the reader to think about this.
If you want to achieve essentially risk free return on capital, and you have funds that you are looking to invest, you can now LOCK IN a whopping 1% return for the next TWO YEARS if you buy and hold Two Year Treasuries. Speaking a bit sarcastically here - now that's the stuff dreams are made of are they not?
Seriously, a measly 1% return for TWO YEARS!
So what are some investors doing. Well, boy howdy, they are determined to get more return on invested capital than that so they are now content to lock up that same amount of capital for TEN YEARS which will allow them to get 2.19%. Yes sir - I can see the huge number of billionaire investors coming out of that play!
This horrific predicament, compliments of our masters at the Central Banks, is forcing money to chase yield meaning that it is going further out along the curve to the long end. The more money that enters any bond market, the LOWER yields go since bond prices move inversely to the yield. When demand for anything increases, its price rises. Bonds, bills, notes, are no exception. As the money flows increase into the long end of the curve, at a faster rate than the money flows might be increasing into the shorter end of the curve, the price of the longer dated bonds rises faster than the price of the shorter dated bonds ( bills, notes,. etc). That means a flattening curve.
Secondly, and something that is extremely relevant to what is going on here - FOREIGN INVESTORS are sending monies overseas to chase yield as well. Think of where interest rates are in both Japan and in the Eurozone compared to comparable dated government debt here in the US. Those foreign flows do two things. They boost the price of the longer dated Treasuries as well as boosting demand for US Dollars.
This phenomenon tends to support both the Dollar's value on the foreign exchange markets as well as keeping prices for those longer dated Treasuries well supported. Again, bond prices move inversely to yields thus the more money flows into the longer dated treasuries, the more those yields tend to move lower.
10-Year Treasury Yield Daily Chart
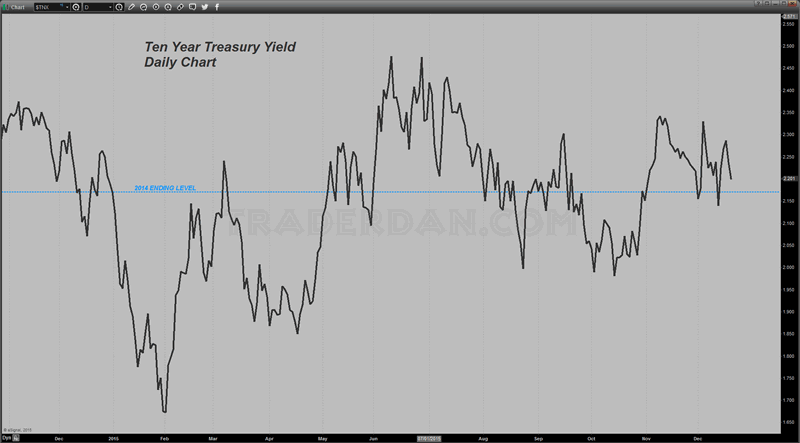
Look at what the result of both of these above factors have done to the yield on the Ten Year Treasury. Its yield was 2.170% on the last day of 2014. Today, its yield is 2.19%. We are only a short two weeks away from ending this year and we are basically back to where we started this year. We have essentially gone nowhere on yields.
What is perhaps even more alarming is that the curve is flattening further. The low point on this spread occurred in early February of this year when it reached 1.19%. Today, it closed at 1.22%. We are talking about a mere 3 basis points from the curve having flattened to a 2015 low!
Ten Year - Two Year Spread
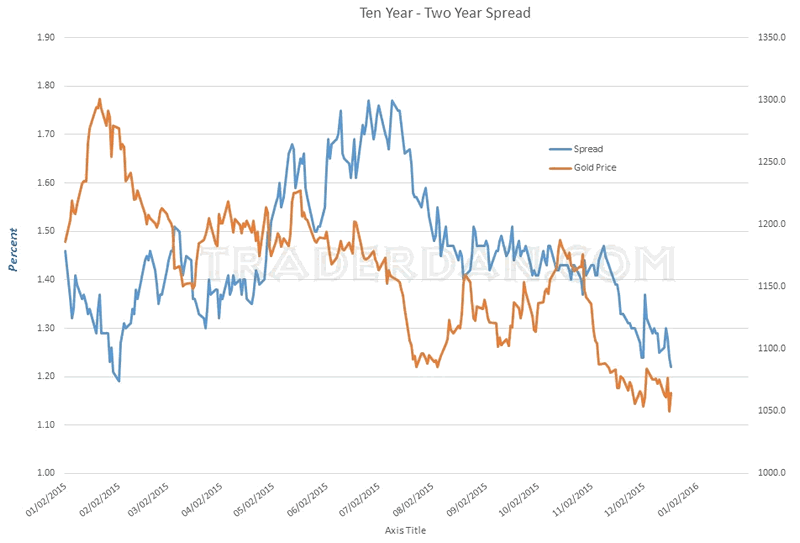
Clearly, this is NOT A VOTE FOR STRONG ECONOMIC GROWTH laying ahead.
Perhaps this is the reason that the equity markets are beginning to show signs of wobbling.
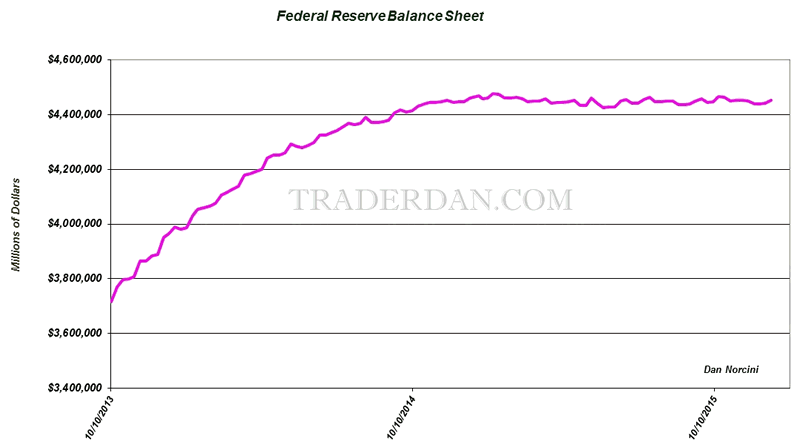
What some analysts have been saying is that once the Fed started to raise rates, the stock market would come under pressure because the move would be a signal that the Fed has begun the process to slowly drain the liquidity that has fueled its monster seven year rally. I personally take issue with that in the sense that the Fed has not made any move towards actually reducing liquidity that I am aware of. After all, while they did increase the short term target rate by 1/4%, one can hardly say that the interest rate environment is not accomodative. Furthermore, the size of its balance sheet remains the same as it has been in some time nor have I seen any talk coming from the Fed that it intends to reduce that balance sheet.
Here is a chart of the Fed Balance Sheet beginning in October of 2013 ( I chose this month at random). Notice how constant the line has remained over the last year. As you can see, there has been no shrinking of the Balance sheet.
Federal Reserve Balance Sheet
What I think appears to be causing concerns in the stock market is the fact that the yield curve is signaling that economic growth is not going to be increasing. That has gotten some stock investors nervous that perhaps stocks are overvalued. After all, it is hard to make the case that the equity markets should be hitting new lifetime highs when the yield curve is collapsing!
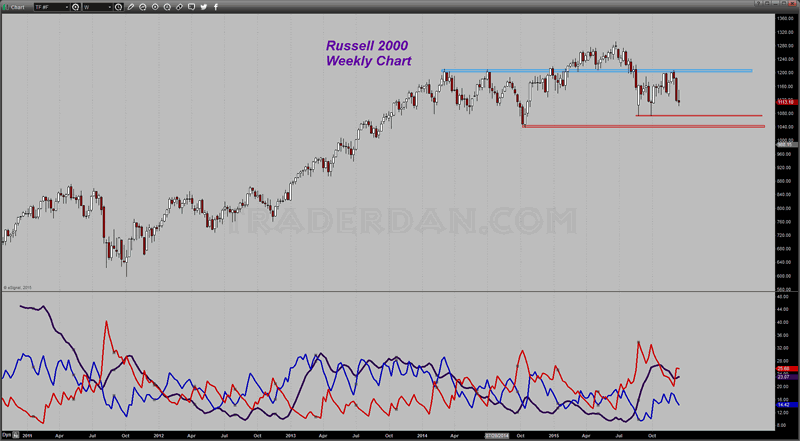
Here are some charts of both the S&P 500 and the Russell 2000.
Notice how both of these very broad equity indices are struggling near their lifetime highs.
Russell 2000 Weekly Chart
eMini S&P500 Weekly Chart
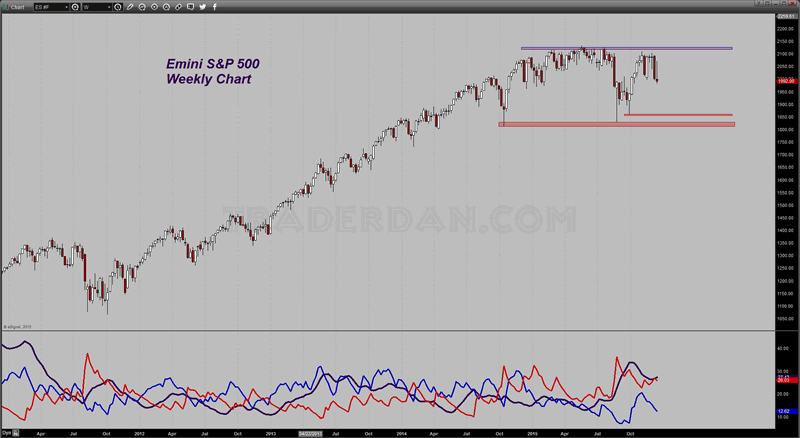
Although both of these broad indices have clearly lost upside momentum, ( note the bears in control ), neither have they broken down technically either as both remain above their respective chart support levels. At this point, what we can objectively state is that both remain in sideways trading patterns below their lifetime highs but above their late summer/early fall lows.
That is why calling for either a resumption of the bull market in equities or the beginning of a bear market in stocks is premature. We simply do not know as we have no chart confirmation at this point other than the details I just stated, namely that upside momentum has stalled out.
Whether or not the bulls can resolve this impasse to the upside is unclear. My main point is that as long as the yield curve is continuing to flatten, it is very difficult for me to see how the bulls can do just that.
One last thing - today's bizarre rally across the entirety of the commodity sector is also contradicted by that flattening yield curve. In such an environment in which the curve is flattening, the commodity asset class is not going to embark on a new bull market. That is the reason today's rally remains very suspect in my opinion and looks to have consisted primarily of short covering by those who had made some pretty good profits by being short this sector and deciding to book gains before heading to the exits ahead of Christmas week.
Dan Norcini
Dan Norcini is a professional off-the-floor commodities trader bringing more than 25 years experience in the markets to provide a trader's insight and commentary on the day's price action. His editorial contributions and supporting technical analysis charts cover a broad range of tradable entities including the precious metals and foreign exchange markets as well as the broader commodity world including the grain and livestock markets. He is a frequent contributor to both Reuters and Dow Jones as a market analyst for the livestock sector and can be on occasion be found as a source in the Wall Street Journal's commodities section. Trader Dan has also been a regular contributor in the past at Jim Sinclair's JS Mineset and King News World as well as may other Precious Metals oriented websites.
Copyright © 2015 Dan Norcini - All Rights Reserved
All ideas, opinions, and/or forecasts, expressed or implied herein, are for informational purposes only and should not be construed as a recommendation to invest, trade, and/or speculate in the markets. Any investments, trades, and/or speculations made in light of the ideas, opinions, and/or forecasts, expressed or implied herein, are committed at your own risk, financial or otherwise. The information on this site has been prepared without regard to any particular investor’s investment objectives, financial situation, and needs. Accordingly, investors should not act on any information on this site without obtaining specific advice from their financial advisor. Past performance is no guarantee of future results.
Dan Norcini Archive |
© 2005-2022 http://www.MarketOracle.co.uk - The Market Oracle is a FREE Daily Financial Markets Analysis & Forecasting online publication.