


Stocks Bear Market is On Hold For Now
Stock-Markets / Stock Markets 2015 Dec 28, 2015 - 06:50 AM GMTBy: Andre_Gratian

 Current Position of the Market
SPX: Long-term trend - Still Bull Market?
SPX: Intermediate trend - The index may have made a secondary top at the 2104 level and started another decline of intermediate duration.
Analysis of the short-term trend is done on a daily basis with the help of hourly charts. It is an important adjunct to the analysis of daily and weekly charts which discuss longer market trends.
BEAR MARKET IS ON HOLD FOR NOW
Market Overview
Last week, the bears had a chance to show that they were in control of SPX. All they needed to do was to extend the decline from 2076 decisively below the recent low of 2094. That would have brought us a step closer to establishing the beginning of a bear trend. But the bulls would have none of that! They stopped the price retracement at Friday's close above 2094, and started a new short-term uptrend which had risen sixty-one points by the end of the short trading week. I suspect that Santa was complicit in this! He would not be denied his Christmas rally.
If the SPX makes a top at Thursday's high and starts a decline which drops below 2094, the bears will regain control of the downtrend which started at 2116. In fact, failure to do so could shift the bias to the upside, especially if it rises above 2103 and follows through above 2116. That would give the appearance of the pattern from 2116 to date that of a completed correction and signal the start of a new and final phase for the bull market.
The SPX500 is not necessarily the best representative of the entire stock market. As its name implies, it only trades 500 stocks and several of these are high-priced stocks which unduly influence the average. The NYSE which trades 2800 stocks might better represent the stock market. Let's take a look at it to see if it differs significantly from SPX.
NYSE Daily Chart Analysis
At first glance, we find that, while the two indices show a similarity of patterns, there are some significant differences in the overall relative strength of the two indices. They were essentially the same until May, but after that date, the NYSE started to get progressively weaker than SPX, a condition that has persisted until today!
The NYSE (chart courtesy of QCharts.com, as well as others below) broke below its intermediate trend line in June, a full month before the SPX which only did so during the August decline. Both charts had shown an ending diagonal pattern preceding their reversals, but the NYSE declined below the starting point of the wedge, while SPX found support above it. And finally, the decline of the NYSE reached below its long-term trend line from 2009 while SPX stayed about 150 points above. That makes the NYSE relatively weaker than SPX and in a better positon to give a confirmed bear market signal. Both indices are currently in a recovery mode with that of the NYSE being much weaker. The last two short-term lows again dipped below the long-term trend line, but have managed to remain just above.
I have posted the NY Summation Index (courtesy of StockCharts.com) directly below the NYSE chart. It shows that the index was rescued from an extended decline when the NYSI showed some positive divergence at the August low. That divergence continued as the rally unfolded with the NYSI coming much closer to its May peak than the price index, but much of it has been lost since the recovery high. We should continue to observe closely the relative price movement between the two price indices, as well as the NYSI action relative to both. It should not be too long before we know with more certainty the direction of the intermediate and long-term trends.
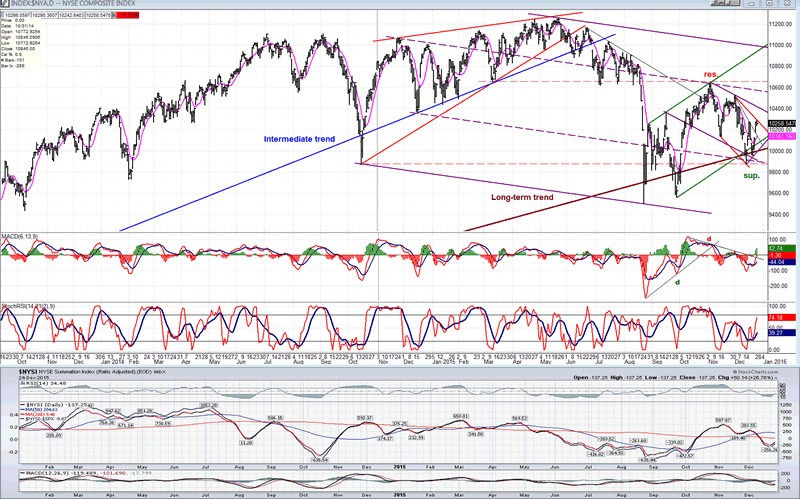
Chart Analysis of SPX
Daily chart
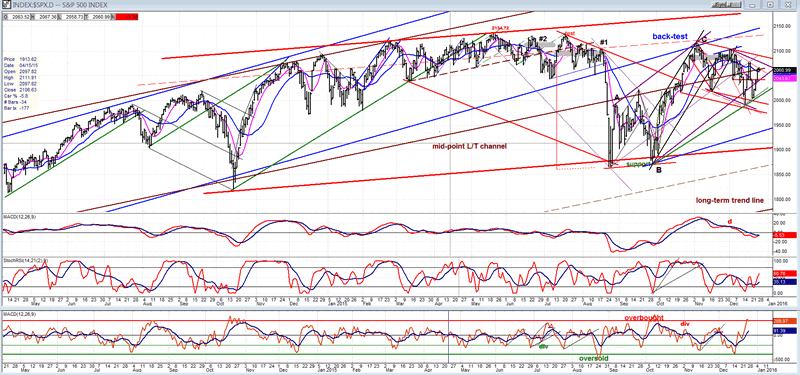
I have posted the SPX chart in the same time frame as NYSE so that you can more easily see their relative positions, although you may not be able to get them both on the same computer page for easier viewing. However, you won't need a detailed analysis for that purpose. Just note where the long-term trend line of both is situated, as well as the distance by which the NYSE fell short of back-testing its intermediate trend line on the rally from the August lows.
As far as the SPX is concerned, it would have to drop about 250 points to challenge its long-term trend line, while the NYSE is already on it. Both indices have been trying to extend their rallies from the August low without much success, so far. Another attempt may be developing since the daily price indicators are trying to establish an uptrend with the A/D oscillator making the strongest showing, and this has created a short-term positive divergence with price which is normally bullish. Also, the type of consolidation which has been formed by the SPX gives it a good chance of resolving to the upside. In the Market Overview, I have already mentioned the criteria needed for that index to create another up-phase. Let's see if it can do it.
On the very short-term however, we appear to have made a top just before the close on Thursday and a retracement is likely. We will see this better on the following hourly chart. How much of a retracement is the key to deciding what the odds are for the SPX to resume its uptrend. I already mentioned in the last letter that, according to Eric Hadik's cycle analysis (www.insiidetrack.com ), the current cycle configuration does not favor the bulls. We'll see!
Hourly chart
If SPX is going to extend its rally, it will have to get out of the two nearly lateral channels that it has formed during its consolidation: one red and the other black (which is a little narrower and has a slightly steeper angle). The lower (dashed) parallel to the black channel line arrested the second short-term downtrend. The higher parallel has now stopped both uptrends, with help of the (red) 200-hr MA. With the price apparently trapped between the two parallels, our first clue will emerge when the index chooses the direction of the break-out. With other important trend lines offering their help, there is more near-term support at the low than there is resistance at the high, and a break of that support would be a clear negative - if it follows through beyond the bottom red channel line as well!
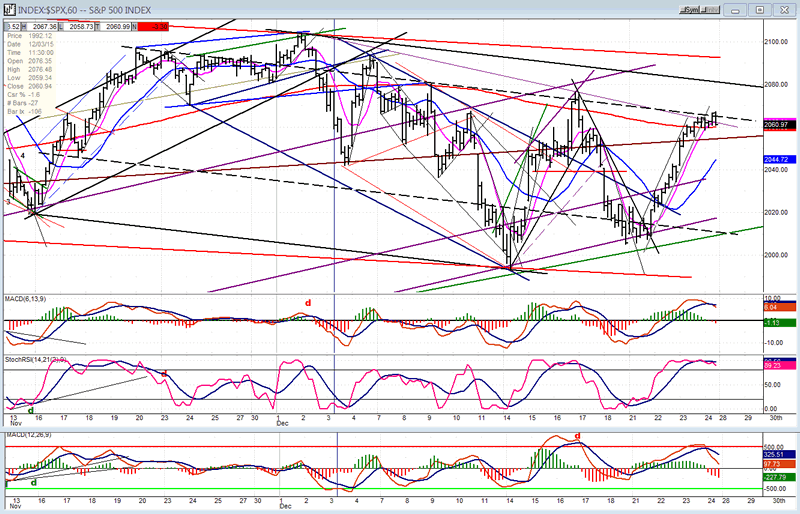
The indicators are suggesting that we are making a short-term top. The A/D oscillator has already turned down and the other two appear ready to follow.
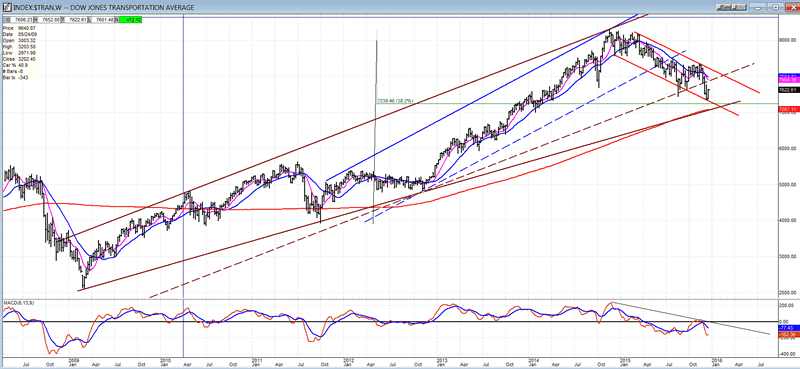
TRAN (Dow Jones Transportation Average)
I have been posting a daily chart of the transportation index to show its tendency to lead the SPX on the downside ever since the top was made. But the weekly chart, while confirming this on the one hand, also shows a more positive side of the TRAN which makes it look a little stronger than the daily chart implies. This deserves more analysis.
The intermediate blue channel has decisively been violated by a wide margin, and the index could not even come close to back-testing the bottom channel line, as the SPX did. However, the long-term trend (which is delineated here in brown) can be interpreted in two ways. The more bearish one would be to draw a line connecting the tops of the move, and draw a (dashed) parallel at the Oct. 2012 low. This gives us a lower trend channel line which briefly supports the August low. But it was recently broken decisively by a quick move to the bottom of the small red channel, bringing it very close to having reached the .382 retracement level of the intermediate uptrend which could provide some temporary support.
If we draw a trend line across the two lows, it currently matches the 200-DMA and the index is still above both. That gives us a more bullish interpretation of the entire trend, but not enough to compare favorably with that of the SPX. Wherever the placement of the long term trend line may be, the TRAN chart still shows relative weakness to the SPX.
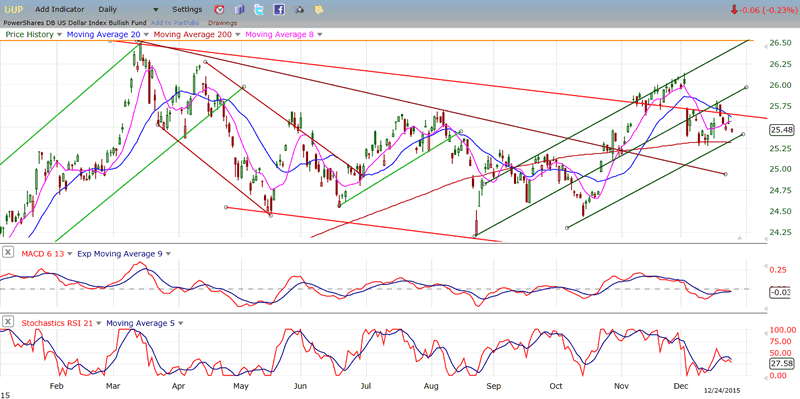
UUP (dollar ETF)
The dollar continues to consolidate after running into resistance at the top of its short term channel. Having retraced to the bottom of that channel, it may now be ready to continue its progression upward.
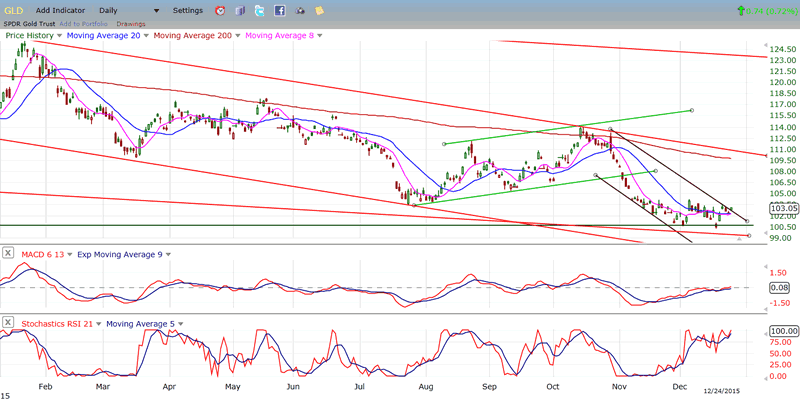
GLD (Gold trust)
I am not sure if GLD is building a base at its current level, or if it's getting ready to make a final low down to about a 97-98 target. The SRSI has been overbought for over two weeks, but that does not guarantee that another decline is coming, altholugh it does favor that outcome.
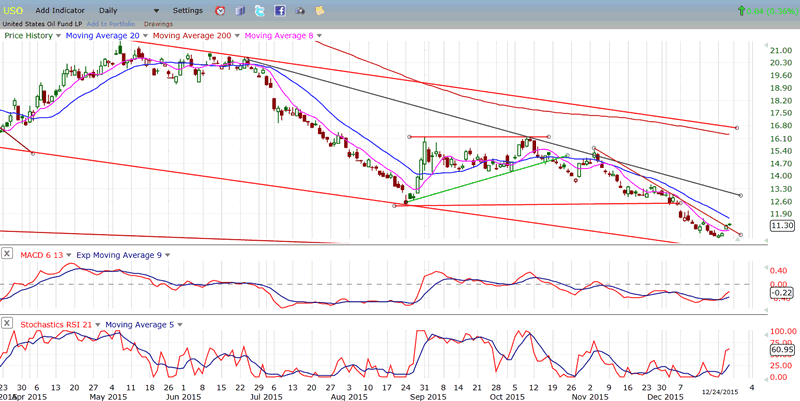
USO (United States Oil Fund)
USO has bounced after making a new low, but it does not yet look like a serious attempt at reversing its long-term trend. Odds still favor a continuation of the decline down to 8.
Summary
The SPX's direction is still unclear and it will need a little more time to reveal itself. Another attempt at extending its uptrend appears to have resulted in a failure to make significant progress, indicating that another short term pull-back may be imminent. The daily indicators are somewhat mixed with a bullish bias. However, the longer term charts of the Transportation index and of the NYSE are relatively weaker and much closer to giving a long-term sell signal. If they do, the SPX and other indices will likely follow.
FREE TRIAL SUBSCRIPTION
If precision in market timing for all time framesis something that you find important, you should
Consider taking a trial subscription to my service. It is free, and you will have four weeks to evaluate its worth. It embodies many years of research with the eventual goal of understanding as perfectly as possible how the market functions. I believe that I have achieved this goal.
For a FREE 4-week trial, Send an email to: info@marketurningpoints.com
For further subscription options, payment plans, and for important general information, I encourage
you to visit my website at www.marketurningpoints.com. It contains summaries of my background, my
investment and trading strategies, and my unique method of intra-day communication with
subscribers. I have also started an archive of former newsletters so that you can not only evaluate past performance, but also be aware of the increasing accuracy of forecasts.
Disclaimer - The above comments about the financial markets are based purely on what I consider to be sound technical analysis principles uncompromised by fundamental considerations. They represent my own opinion and are not meant to be construed as trading or investment advice, but are offered as an analytical point of view which might be of interest to those who follow stock market cycles and technical analysis.
Andre Gratian Archive |
© 2005-2022 http://www.MarketOracle.co.uk - The Market Oracle is a FREE Daily Financial Markets Analysis & Forecasting online publication.