


Investing in Silver - Warp Speed
InvestorEducation / Gold & Silver Mar 15, 2007 - 07:37 PM GMTBy: Roland_Watson

In the search for knowledge that helps us time exit and entry points for the silver market, I was reminded of that old science fiction series Star Trek. Now you may ask what Star Trek has got to do with silver? Well, let me define it as the "Spock-McCoy" syndrome of silver investing.
Watching reruns of that show reminded me of two mindsets when it comes to investing. First we have logical and methodical Mr. Spock who emotionlessly does everything "by the book" and will not let feelings enter into his final calculations and decisions.
Secondly, there is the headstrong Dr. McCoy who would often be bounced off Spock because he did let emotions play a part in his judgments and was often seen chiding Spock for anything that smacked off "cold-bloodedness".

Emotion and logic, what rises to your mental surface most when a decision has to be made against a highly charged background? I am talking about when silver and gold are rising hard and fast and money is being made hand over fist by well-positioned investors. Well, at least on paper money is being made. No profit is received until silver is sold and the money is sitting in your bank.
Let me put it another way. What is the pivotal item of information that will tell you when to take some money off the silver table? Will it be the previous week's COT data? Will it be the amount of silver in the COMEX warehouses? Or will it be something as vague and subjective as your neighbors talking about PAAS or just having a strange feeling in your gut?
Some of these are Mr. Spock stuff and some are Dr. McCoy. But you know, silver may peak out at high COMEX inventories and your neighbors may still be jawboning about their Google shares while silver soars. Meanwhile, your stomach may just be telling you its hungry.
Moreover, the chatter on the Internet may compel you to hang on because the common quote may be " Silver to double from here! " Back in 1980, not a few were hollering " $2000 gold! " while the price dropped into a growling, grizzly twenty year bear. We are clearly in Dr. McCoy territory here.
Why did they say $2000 gold back then? Because they thought the US Dollar was dead and inflation was unstoppable. Wrong and wrong again.
Rule number one - never underestimate the powers that be.
Rule number two - never overestimate the power of gold and silver.
That is why we side with Mr. Spock in this matter. We are aware of the fundamentals but they're not going to tell you whether silver is going to hit $50, $100 or $200 let alone in what year or decade.
Mr. Spock was a technical analyst and so are we. We examine, modify, experiment, test and modify again. Our data is irrefutable - the price of silver. Our conclusions are probabilistic based on technical indicators back tested against all the known data.
Technical indicators are emotionless. They are not swayed by the latest pronouncements from revered commentators. They simply say three words: buy, hold or sell. They are the Mr. Spocks of the gold and silver investment world. While the bulls and bears experts fulminate against each other across the investment divide, the technical indicators do not care. They take no sides; they just sit there until it is time to utter of those three words.
I listen for those words from several Mr. Spocks. Some are the tried and trusted indicators known across the investment world. I also track our own longer-term SLI and RMAR indicators. But today I want to mention another indicator I was dabbling with recently. It answers to the essay title. How fast is silver?
In physics, speed or velocity is a simple formula. It is the distance covered divided by the time elapsed. This number can be positive or negative if our object is going forwards or backwards. Ever wondered how fast silver is? Let's change the formula. The time remains the same but it is distance covered in terms of dollars that we will compute.
The graph below charts the speed of silver over the last forty years. This speed is calculated as the weekly change in the closing price of silver divided by seven days. This gives us the speed of silver as number of cents per calendar day. We could have used trading days but it doesn't matter so long as one is consistent in the application of the formula. I have also overlaid the corresponding price of silver in red.
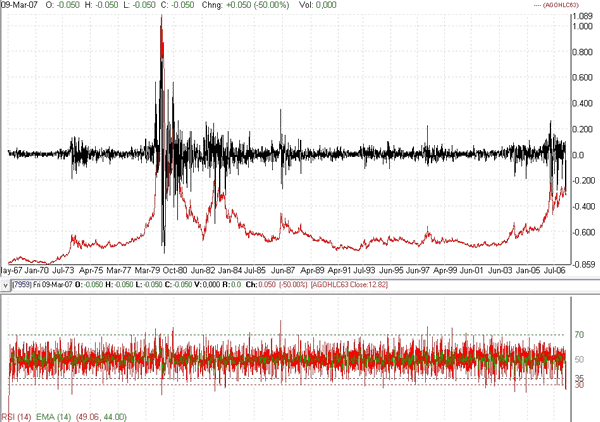
The right axis gives the silver speed ranging from up 1 dollar up per day to 80 cents down per day. In general though, the speed of silver has trundled along at a few cents per day. Those more mathematically minded amongst you may notice that from 1980 to 2003, the velocity of silver exhibited a pattern similar to a damped acoustic waveform. This is the kind of waveform produced when an earthquake hits and then experiences a die-off with aftershocks.
In this case the 1970s silver bull was the earthquake and the aftershocks were the failed rallies. At one point the silver bull hit a top speed of a dollar a day before it hit the fence. This kind of speed has not been witnessed since. The top speed so far in this current bull market has been 26 cents per day last May.
I won't say more on this waveform aspect since I wish to focus on the RSI chart at the bottom of the chart. The RSI is the well-known Relative Strength Index invented by Welles Wilder and widely used by myself and many other investors. It is basically an overbought/oversold indicator and you can read more about it here . Normally, an RSI level of 70 alerts us to an overbought situation and 30 warns of an oversold situation.
Does the RSI for silver velocity tell us anything about major tops or bottoms in silver? I don't think it does, as there are too many false signals. However, if we apply another well known mathematical formula to the data on this graph, we come up with the second graph shown below.
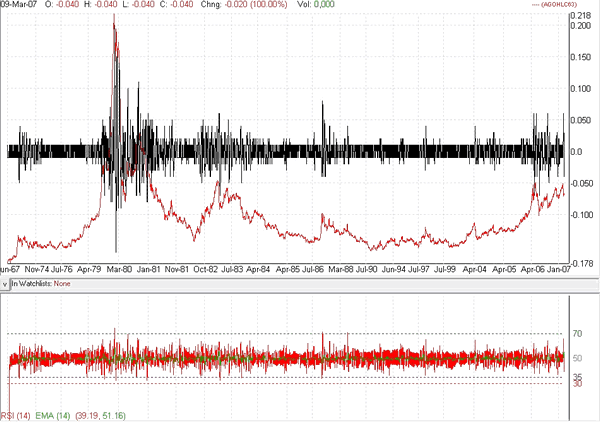
In this silver waveform, the RSI is less volatile. In fact, the overbought signal triggers on only three occasions in forty years. The first was on the 25th January 1980 just four days after the actual price peak. Silver peaked at $42.07 on a closing basis on the 21st January while the closing price on the 25th was $38.10 (or $37.12 if actioned the next trading day). Coincidentally our other indicator, the Silver Leverage Indicator (SLI) also triggered a sell on that day!
Two more followed around the rally to $9.80 on the 27th April 1987. The first triggered on the 1st May 1987 at $8.14 (or $8.35 if actioned the next trading day). The second triggered on the 28th July 1988 at $7.00 a week after silver held a mini-rally to $8.05 on the 21st July 1988. However, this signal would have been redundant since one would not have reentered silver between the two sell signals.
Notice that our velocity indicator did not flag any sell signal for the 1983, 1998, 2004 and 2006 peaks. This is due to the fact that since this is a speed indicator, they evidently were not moving fast enough to register a traffic violation!
If the next blow off gathers more pace than the 2004 and 2006 peaks, I suspect the RSI will go over the speed limit of 70. That remains to be seen, but we have other indicators to flag when long term moves in silver are getting overheated.
In conclusion, are you a Mr. Spock or a Dr. McCoy? You will probably judge yourself as being in between. But we may find out a bit more about ourselves when silver is soaring and we have to make a judgment about when to exit and how. Will emotion or logic win?
May your silver judgments live long and prosper!
By Roland Watson
http://silveranalyst.blogspot.com
Further analysis of the SLI indicator and more can be obtained by going to our silver blog at http://silveranalyst.blogspot.com where readers can obtain the first issue of The Silver Analyst free and learn about subscription details. Comments and questions are also invited via email to silveranalysis@yahoo.co.uk
© 2005-2022 http://www.MarketOracle.co.uk - The Market Oracle is a FREE Daily Financial Markets Analysis & Forecasting online publication.