Saudi Arabia and OPEC Manipulate Oil Prices to Eliminate It’s Competition
Commodities / Crude Oil Jan 04, 2016 - 03:54 PM GMTBy: Chris_Vermeulen
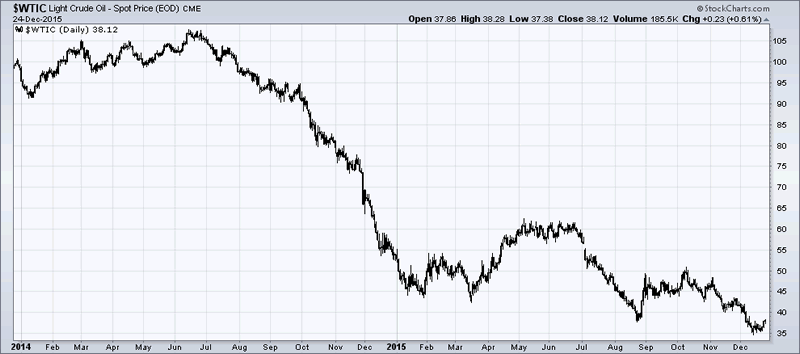
 About eighteen months ago the international price of WTI Crude Oil, at the close of June 2014, was $105.93 per barrel. Flash-forward to today; the price of WTI Crude Oil was just holding above $38.00 per barrel, a drastic fall of more than 65% since June 2014. I will point out several reasons behind this sharp, sudden, and what now seems to be prolonged slump.

The Big Push
Despite a combination of factors triggering the fall in prices, the biggest push came from the U.S. Shale producers. From 2010 to 2014, oil production in the U.S. increased from 5,482,000 bpd to 8,663,000 (a 58% increase), making the U.S. the third largest oil-producing country in the world.
The next big push came from Iraq whose production increased from 2,358,000 bpd in 2010 to 3,111,000 bpd in 2014 (a 32% increase), mostly resulting from the revival of its post-war oil industry.
The country-wide financial crunch, and the need for the government to increasingly export more to pay foreign companies for their production contracts and continue the fight against militants in the country took production levels to the full of its current capacity.
In addition; global demand remained flat, growing at just 1.1% and even declining for some regions during 2014. Demand for oil in the U.S. grew just 0.6% against production growth of 16% during 2014.
Europe registered extremely slow growth in demand, and Asia was plagued by a slowdown in China which registered the lowest growth in its demand for oil in the last five years. Consequently, a global surplus was created courtesy of excess supply and lack of demand, with the U.S. and Iraq contributing to it the most.
The Response
In response to the falling prices, OPEC members met in the November of 2014, in Vienna, to discuss the strategy forward. Advocated by Saudi Arabia, the most influential member of the cartel, along with support from other GCC countries in the OPEC, the cartel reluctantly agreed to maintain its current production levels.
This sent WTI Crude Oil and Brent Oil prices below $70, much to the annoyance of Russia (non-OPEC), Nigeria and Venezuela, who desperately needed oil close to $90 to meet their then economic goals.
For Saudi Arabia, the strategy was to leverage their low-cost of production advantage in the market and send prices falling beyond such levels so that high-cost competitors (U.S. Shale producers are the highest cost producers in the market) are driven out and the market defines a higher equilibrium price from the resulting correction. The GCC region, with a combined $2.5 trillion in exchange reserves, braced itself for lower prices, even to the levels of $20 per barrel.
The Knockout Punch
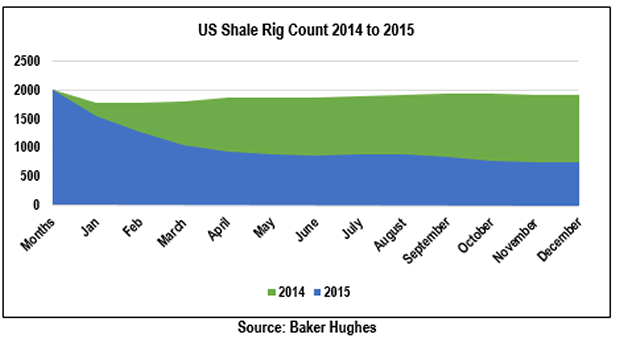
By the end of September 2014, according to data from Baker Hughes, U.S. Shale rigs registered their highest number in as many years at 1,931. However, they also registered their very first decline to 1,917 at the end of November 2014, following OPEC’s first meeting after price falls and its decision to maintain production levels. By June 2015, in time for the next OPEC meeting, U.S. Shale rigs had already declined to just 875 by the end of May; a 54% decline.

The Saudi Arabia strategy was spot on; a classic real-life example of predatory price tactics being used by a market leader, showing its dominant power in the form of deep foreign-exchange pockets and the low costs of production. Furthermore, on the week ending on the date of the most recent OPEC meeting held on December 4th, 2015, the U.S. rig count was down even more to only 737; a 62% decline. Despite increased pressure from the likes of Venezuela, the GCC lobby was able to ensure that production levels were maintained for the foreseeable future.
Now What?
Moving forward; the U.S. production will decline by 600,000 bpd, according to a forecast by the International Energy Agency. Furthermore, news from Iraq is that its production will also decline in 2016 as the battle with militants gets more expensive and foreign companies like British Petroleum have already cut operational budgets for next year, hinting production slowdowns. A few companies in the Kurdish region have even shut down all production, owing to outstanding dues on their contracts with the government.
Hence, for the coming year, global oil supply is very much likely to be curtailed. However, Iran’s recent disclosure of ambitions to double its output once sanctions are lifted next year, and call for $30 billion in investment in its oil and gas industry, is very much likely to spoil any case for a significant price rebound.
The same also led Saudi Arabia and its GCC partners to turn down any requests from other less-economically strong members of OPEC to cut production, in their December 2015, meeting. Under the current scenarios members like Venezuela, Algeria and Nigeria, given their dependence on oil revenues to run their economies, cannot afford to cut their own production but, as members of the cartel, can plea to cut its production share to make room for price improvements, which they can benefit from i.e. forego its market share.
It’s Not Over Until I’ve Won
With news coming from Iran, and the successful delivery of a knockout punch to a six-year shale boom in the U.S., Saudi Arabia feared it would lose share to Iran if it cut its own production. Oil prices will be influenced increasingly by the political scuffles betweenSaudi Arabia and its allies and Iran. The deadlock and increased uncertainty over Saudi Arabia and Iran’s ties have sent prices plunging further. The Global Hedge Fund industry is increasing its short position for the short-term, which stood at 154 million barrels on November 17th, 2015, when prices hit $40 per barrel; all of this indicating a prolonged bear market for oil.
One important factor that needs to be discussed is the $1+ trillions of junk bonds holding up the shale and other marginal producers. As you know, that has been teetering and looked like a crash not long ago. The pressure is still there. As the shale becomes more impaired, the probability of a high-yield market crash looks very high. If that market crashes, what happens to oil? Wouldn’t there be feedback effects between the oil and the crashing junk market, with a final sudden shutdown of marginal production? Could this be the catalyst for a quick reversal of oil price?
The strategic interests, primarily of the U.S. and Saudi Arabia; the Saudis have strategically decided to go all in to maintain their market share by maximizing oil production, even though the effect on prices is to drive them down even further. In the near term, they have substantial reserves to cover any budget shortfalls due to low prices. More importantly, in the intermediate term, they want to force marginal producers out of business and damage Iran’s hopes of reaping a windfall due to the lifting of sanctions. This is something they have in common with the strategic interests of the U.S. which also include damaging the capabilities of Russia and ISIS. It’s certainly complicated sorting out the projected knock-on effects, but no doubt they are there and very important.
I’ll Show You How Great I Am
Moreover, despite a more than 50% decline in its oil revenues, the International Monetary Fund has maintained Saudi Arabia’s economy to grow at 3.5% for 2015, buoyed by increasing government spending and oil production. According to data by Deutsche Bank and IMF; in order to balance its fiscal books, Saudi Arabia needs an oil price of $105. But the petroleum sector only accounts for 45% of its GDP, and as of June 2015, according to the Saudi Arabian Monetary Agency, the country had combined foreign reserves of $650 billion. The only challenge for Saudi Arabia is to introduce slight taxes to balance its fiscal books. As for the balance of payments deficit; the country has asserted its will to depend on its reserves for the foreseeable future.
Conclusion
The above are some of the advantages which only Saudi Arabia and a couple of other GCC members in the OPEC enjoy, which will help them sustain their strategy even beyond 2016 if required. But I believe it won’t take that long. International pressure from other OPEC members, and even the global oil corporations’ lobby will push leaders on both sides to negotiate a deal to streamline prices.
With the U.S. players more or less out by the end of 2016, the OPEC will be in more control of price fluctuations and, therefore, in light of any deal between Iran and Saudi Arabia (both OPEC members) and even Russia (non-OPEC), will alter global supply for prices to rebound, thus controlling prices again.
What we see now in oil price manipulation is just the mid-way point. Lots of opportunity in oil and oil related companies will slowly start to present themselves over the next year which I will share my trades and long term investment pays with subscribers of my newsletter at TheGoldAndOilGuy.com
END OF YEAR SPECIAL GET 12 MONTH OF TRADE ALERTS FOR THE PRICE OF ONLY 6 MONTHS!
Chris Vermeulen
Join my email list FREE and get my next article which I will show you about a major opportunity in bonds and a rate spike – www.GoldAndOilGuy.com
Chris Vermeulen is Founder of the popular trading site TheGoldAndOilGuy.com. There he shares his highly successful, low-risk trading method. For 7 years Chris has been a leader in teaching others to skillfully trade in gold, oil, and silver in both bull and bear markets. Subscribers to his service depend on Chris' uniquely consistent investment opportunities that carry exceptionally low risk and high return.
Disclaimer: Nothing in this report should be construed as a solicitation to buy or sell any securities mentioned. Technical Traders Ltd., its owners and the author of this report are not registered broker-dealers or financial advisors. Before investing in any securities, you should consult with your financial advisor and a registered broker-dealer. Never make an investment based solely on what you read in an online or printed report, including this report, especially if the investment involves a small, thinly-traded company that isn’t well known. Technical Traders Ltd. and the author of this report has been paid by Cardiff Energy Corp. In addition, the author owns shares of Cardiff Energy Corp. and would also benefit from volume and price appreciation of its stock. The information provided here within should not be construed as a financial analysis but rather as an advertisement. The author’s views and opinions regarding the companies featured in reports are his own views and are based on information that he has researched independently and has received, which the author assumes to be reliable. Technical Traders Ltd. and the author of this report do not guarantee the accuracy, completeness, or usefulness of any content of this report, nor its fitness for any particular purpose. Lastly, the author does not guarantee that any of the companies mentioned in the reports will perform as expected, and any comparisons made to other companies may not be valid or come into effect.
Chris Vermeulen Archive |
© 2005-2022 http://www.MarketOracle.co.uk - The Market Oracle is a FREE Daily Financial Markets Analysis & Forecasting online publication.


