


VIX Asleep as Stock Market Weakness Escalates
Stock-Markets / Stock Markets 2016 Jan 15, 2016 - 04:04 PM GMTBy: Ashraf_Laidi

 One notable reason the VIX is trading at only half the level seen in August (53.0), a time when equity indices plunged near today's levels is related to market's absorption of risk versus macro negatives.
The China devaluation of August 24 came as a complete surprise to financial markets, which were neither ready for the PBOC's FX manoeuvres, nor prepared for the dangers of rapid decline in the currency of the world's biggest buyer of commodities as they are today.
Indeed, the 98% jump in the VIX of August 24 was also propagated by soaring volumes of VIX and VIX-related products (VIX ETFs and leveraged ETFs), as well as high-frequency trading of these products by banks and algo firms.
Known unknowns
Setting the technical intricacies aside, markets in August were not positioned for a surprise from China and certainly not aware of the intricacies of the yuan's daily fixings and the implications of the onshore vs offshore pricing. At the time, the primary concern was whether the Fed would raise in September or December, as well as the more familiar emerging market concerns.
Today, the sources of market selloff and macro deterioration are not necessarily new or unexpected (tumbling CNY, falling CNY, disappointing macro data) but their implications for eroding capex, widening credit spreads, quantitative FX tightening by emerging markets and forced liquidations by Gulf sovereign wealth funds are more ominous and immediate for the market.
Metrics of Weakness, not Risk
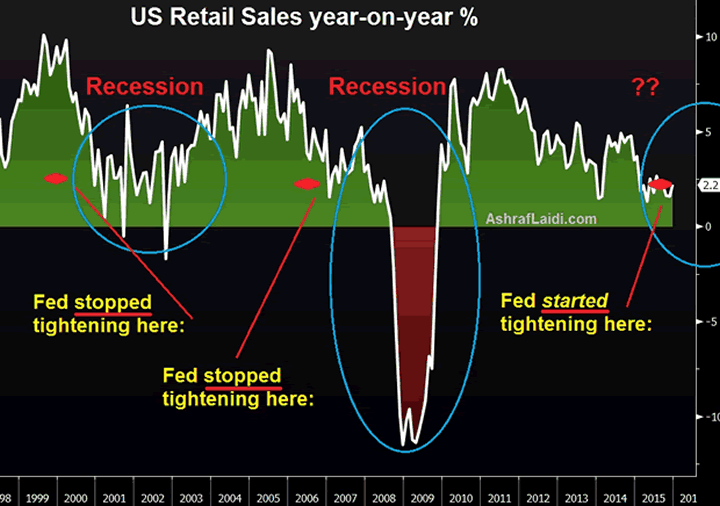
Although the VIX remains inside the 20-40, a level considered as neutral, there are more relevant metrics of macro risk/weakness, namely more elevated high yield spreads (713 bps vs 560 bps in August 24 at 29% higher), flatter yield curve (10-2 spread at 1.19% vs 1.44% in August 24 at 17% higher), oil prices 23% lower and finally a substantially weaker readings in manufacturing and retail sales (see chart).
Complacency
Downside risks may more anticipated today but market participants, but their confluence and intensity has far reaching implications than five months ago. We expect oil prices to reach $17 (unchanged supply from Saudi to accommodate Iran's production, falling demand from the Gulf and China, halted exploration projects and policy easing from Canada) to accelerate the deflationary pressures and push the Fed back into negative interest rates in Q3 of this year.
By Ashraf Laidi
AshrafLaidi.com
Ashraf Laidi CEO of Intermarket Strategy and is the author of "Currency Trading and Intermarket Analysis: How to Profit from the Shifting Currents in Global Markets" Wiley Trading.
This publication is intended to be used for information purposes only and does not constitute investment advice.
Copyright © 2016 Ashraf Laidi
Ashraf Laidi Archive |
© 2005-2022 http://www.MarketOracle.co.uk - The Market Oracle is a FREE Daily Financial Markets Analysis & Forecasting online publication.