Gold Stock Set Up In 1 Chart Cartel~Buster® !, For You
Commodities / Gold and Silver Stocks 2016 Jan 21, 2016 - 04:29 PM GMTBy: Denali_Guide
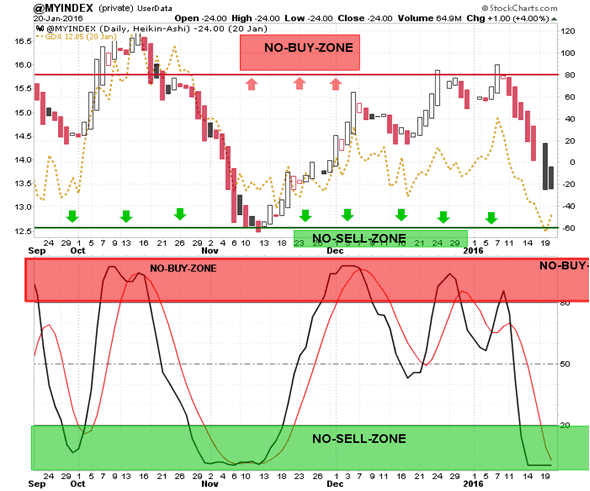
LAST time we got a very nice signal, say Nov 5-9th, we spent about 5 or 6 market sessions in limbo before the GDX (dashed gold line) price responded fully, although individual stocks responded, some faster (AEM), some slower (AUY).
Today provisional signal is not really any different. Each panel on this chart of my proprietary measure “CARTEL~BUSTER® !, contains its own Tripwire Zones, for buying and selling. Either or both works well. Thus the bottom panel is a bit faster for shorter trades.

What will clinch it for me is how the trend turns, based on the BlueBars in the MACD Histogram (FREE CHARTS @ STOCKCHARTS)-(plug in any SYMBOL) to get a look at the bars. Daily is good, intraday tells you what time the tide is turning from Ebb Tide to Flood Tide. http://stockcharts.com/h-sc/ui?s=AEM&p=D&yr=0&mn=4&dy=0&id=p59608647104 .
Lacking the powers of Harry Houdini, or a reliable crystal ball, I will not say how big or how long this move might be. Given the wet blanket that gets thrown over GoldBugz, who would want to say. My take is we are a tradeable bottom that will manifest itself in the next 5-10 days and could become a trading opportunity. ASAP UPDATES & ALERTS @  Denaliguidesummit.blogspot.ca
© 2016 Copyright Denali Guide - All Rights Reserved
Disclaimer: The above is a matter of opinion provided for general information purposes only and is not intended as investment advice. Information and analysis above are derived from sources and utilising methods believed to be reliable, but we cannot accept responsibility for any losses you may incur as a result of this analysis. Individuals should consult with their personal financial advisors.
© 2005-2022 http://www.MarketOracle.co.uk - The Market Oracle is a FREE Daily Financial Markets Analysis & Forecasting online publication.


