


Gold And Silver - Chart Facts Are Market's Message
Commodities / Gold and Silver 2016 Jan 23, 2016 - 05:30 PM GMTBy: Michael_Noonan

 We keep reiterating that one need not be expert, nor even conversant, in reading a chart to be able to read and appreciate how charts "talk" and reveal very clear information. Opinions are of no consequence, regardless of how strong or otherwise "informed" one is about a market.
A fact is something upon which people of diverging opinions can agree, at least within reason. Each of the following charts contains facts, and it has always been our position that the market has its own message[s] contained in price volume behavior that has a convincing element of reason, no matter what the skill level of one's ability, or lack of, to read a chart.
See if you agree.
We continue to favor silver purchases over gold solely on the basis of the gold:silver ratio having extended to the 78:1 area, where a single ounce of gold can buy 78 oz of silver, in theory. In theory because there are transaction costs from a dealer. This week, we took advantage of the ratio and exchanged some gold for silver, on a personal level, getting 75:1 for each oz of gold.
For simplicity's sake, we use 10 oz of gold as our measure, and that translated into 750 oz of silver. The intent over a period of time, usually years, is to switch back from silver into gold. For sake of argument, assume the ratio goes to 40:1. That means it takes 40 oz of silver to buy a single oz of gold. Allowing for transaction costs, assume it takes 44 oz to buy an oz of gold. We had 750 oz, divided by 44, yields 17 oz of gold to switch. Our original 10 oz has now become 17 oz, just from patiently waiting for changes in the ratio to occur.
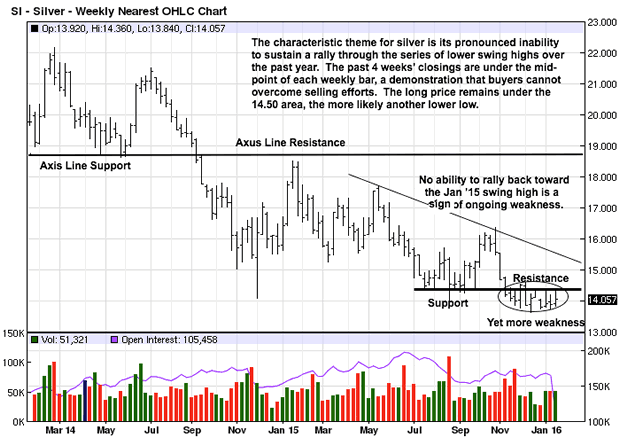
We expect the ratio can continue to 80:1, perhaps higher, we do not know for the chart on the higher weekly time frame does not show any sign of an end to the down trend. The reasoning, based on factual observations from reading developing market activity depicted in the chart, combined with logic, leads to that inescapable conclusion: price is likely to go lower.
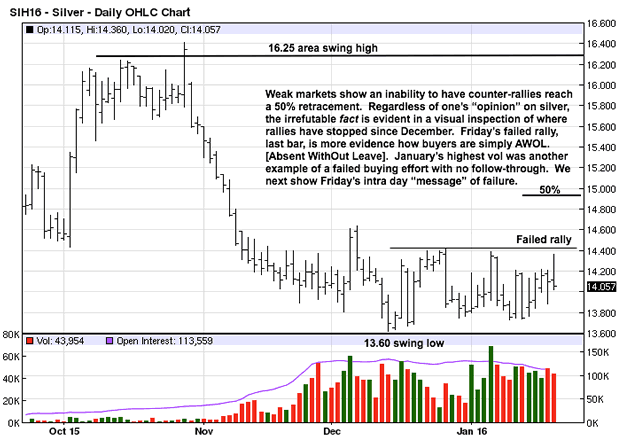
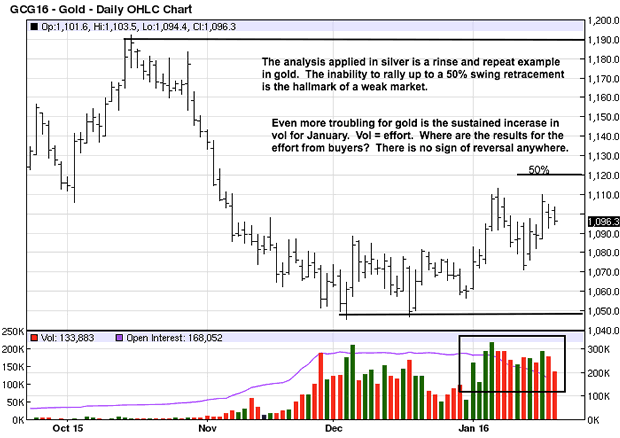
The daily chart supports the weak read for this market. As indicated in the chart comments, the message from the market is weakness, followed by more weakness with each passing week and month.
When will a turnaround occur? As we keep saying, no one knows, and for sure we do not. What we know for certain is that the market will give clear signs when and as a turnaround is developing. For as long as the message remains constant, one must exercise patience. Actually, there is no choice, and those who have been impatient and tried to pick a bottom have paid a price, depending upon how hard-headed one is, or the size of one's margin call.
What is also true is that smart money buys low and sells high, for the most part. It is less important to buy the exact bottom or sell the exact top, for it takes time to accumulate a position during lows, or distribute a position near highs. However, whenever you see large spikes in volume, you can be sure that smart money is on the other side of the trade.
Who is on the other side? Weak handed traders with insufficient staying power.
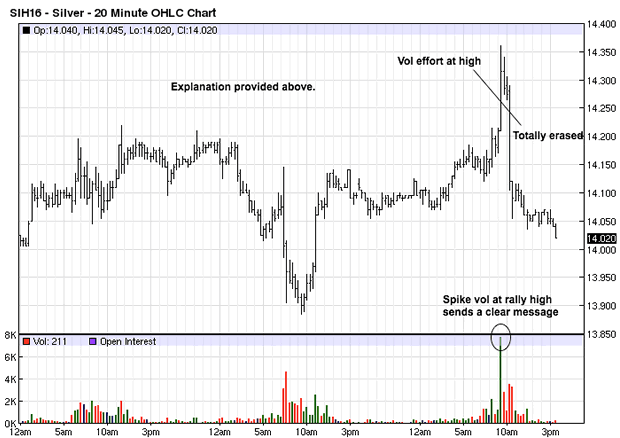
If smart money were buying silver, below, [even though it is only a 20 minute intra day chart, the principle is what matters], their activity, and it shows up in increased volume, would be nearer the lows, and certainly not at the highs. The largest volume spike that sticks out like a sore thumb, occurred at the highs. This is not where smart money would be buying. If not buying, then they must be selling, and weak-handed buyers are buying into the late stages of a rally.
Confirmation occurs a few bars later when an even larger range bar appears to the down side and erasing all the buying effort from the rally to the high. We mentioned weak closes on the weekly chart as an indication that sellers are still in control and buyers cannot hold a rally. This 20 minute chart is an abbreviated time frame that demonstrates this principle over every time frame. It is a message from the market that bears heeding every time.
This chart is an update from one posted a few weeks ago. There was no sign of change then, and that fact has not changed to date. Keep in mind, all of the fundamental information on gold, and silver, is known. The whole world is aware of how bullish the news is, how bullish demand is relative to supply. Yet, despite that information, the market is telling everyone who cares to pay attention that those fundamental factors are not what is moving these markets.
Even if one does not understand the underlying reasons, fundamental or otherwise, it pays to heed what the market is showing and react accordingly. This is still a bear market, all other news notwithstanding. Price is the final arbiter, not one's opinion.
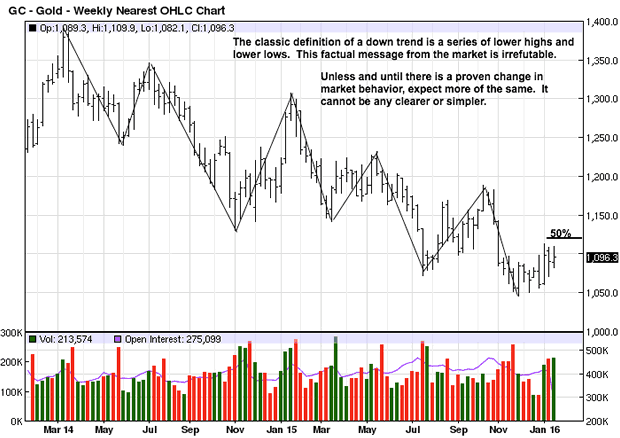
If there were something positive we could say about this chart, we would, but we cannot, and that is enough said.
By Michael Noonan
Michael Noonan, mn@edgetraderplus.com, is a Chicago-based trader with over 30 years in the business. His sole approach to analysis is derived from developing market pattern behavior, found in the form of Price, Volume, and Time, and it is generated from the best source possible, the market itself.
© 2015 Copyright Michael Noonan - All Rights Reserved Disclaimer: The above is a matter of opinion provided for general information purposes only and is not intended as investment advice. Information and analysis above are derived from sources and utilising methods believed to be reliable, but we cannot accept responsibility for any losses you may incur as a result of this analysis. Individuals should consult with their personal financial advisors.
Michael Noonan Archive |
© 2005-2022 http://www.MarketOracle.co.uk - The Market Oracle is a FREE Daily Financial Markets Analysis & Forecasting online publication.