


Raytheon Company: A Defensive Stock for a Defensive Market
Companies / Investing 2016 Feb 03, 2016 - 06:44 PM GMTBy: Sol_Palha

 Company Background
Raytheon Company, together with its subsidiaries, is a technology Company that specializes in defense and other Government markets.
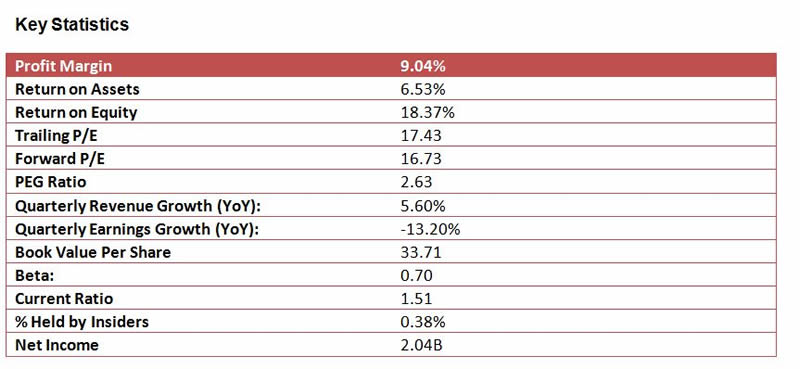

The trend score determines whether a stock is in a bullish or bearish trend. Any score above 50 illustrates that the stock is trending upwards and vice versa. RTN Has a score of 65, which means it is in a slightly bullish trend. This bodes well for the stock. The stock is holding up remarkably well in comparison to the broad market.
12 month projected EPS Growth Chart
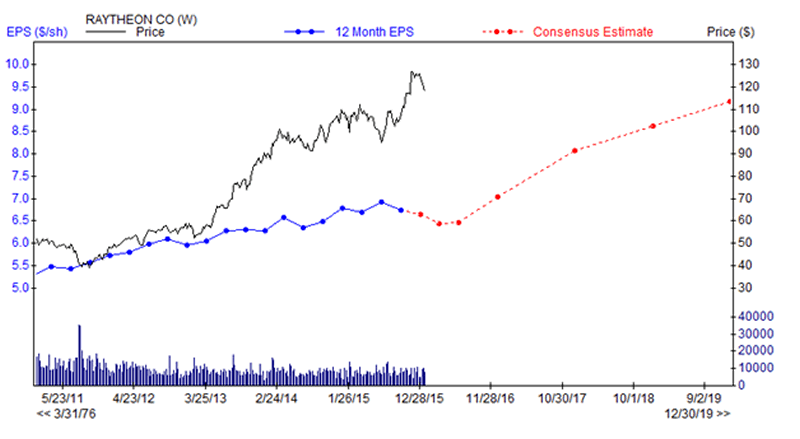
EPS chart provided courtesy of zacks.com
In general, the best rule of thumb is to open positions when the price of the stock is trading above the EPS chart. RTN Has been trading comfortably above this line for some time, and it is projected to maintain this trajectory. The ideal entry point, though this does not often occur would be to open a position when the price of the stock comes close to testing the EPS line. In this case, it would roughly correlate to price in the $95.00-$100.00 ranges. We would not hold our breath only for this price as it might or might not come to pass. The best strategy is to spread your money over a range of entry points.
The Technical outlook
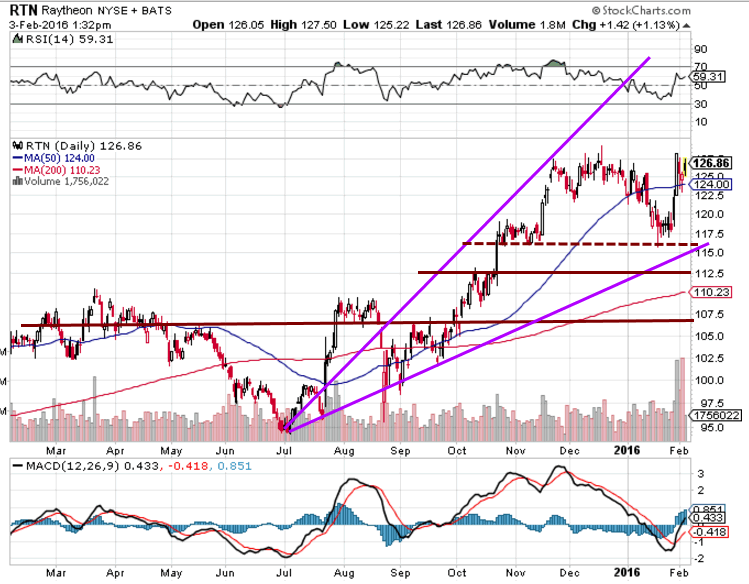
While the stock is trading close to its highs, it is still not fully out of the woods as it is likely to pullback with the general markets that are still going through a corrective phase. However, as you can see the stock has held up remarkably well during the current correction. The stock is likely to soar to a series of all-time new highs once this corrective wave is behind us.
In the interim RTN could test the 111-114 ranges and a weekly close below 110.00 could quickly usher a move down to the 105 ranges. If this occurs, it should be viewed as a lovely long term opportunity. The MACD’s have just experienced a bullish crossover. The stock pays a dividend of roughly 2.6% which combined with the potential capital gains could be attractive for dividend investors. Two other strong stocks in this sector are ESLT and OA. Investors looking to get into RTN should use strong market pull backs to open positions.
by Sol Palha
Sol Palha is a market analyst and educator who uses Mass Psychology, Technical Analysis and Esoteric Cycles to keep you on the right side of the market. He and his partners are on the web at www.tacticalinvestor.com.
© 2016 Copyright Sol Palha- All Rights Reserved
Disclaimer: The above is a matter of opinion provided for general information purposes only and is not intended as investment advice. Information and analysis above are derived from sources and utilising methods believed to be reliable, but we cannot accept responsibility for any losses you may incur as a result of this analysis. Individuals should consult with their personal financial advisors.
© 2005-2022 http://www.MarketOracle.co.uk - The Market Oracle is a FREE Daily Financial Markets Analysis & Forecasting online publication.