GOLD In Two Words - BULL MARKET
Commodities / Gold and Silver 2016 Feb 14, 2016 - 03:54 PM GMTBy: Denali_Guide
 BULL MARKET = 2 Words
We know it bottomed in Jul 2013. Really !!!
Lets go back to October of 2015 when this appeared on this blog.
GOLD NOW IS U$D 1336 - FIGURED IN COIN SHOPS FRIDAYS CLOSE WAS 1310 U$D, SO IT CORRELATES TO THE REAL WORLD, SINCE THE COIN SHOP PRICE IS F.O.B. COIN SHOP
****************************************
Emphasis Mine. "REAL GOLD, that which is deliverable metal has bottomed at U$D 1149, with the USDX @ 95, and will not go lower in the next
12 months, without a consequent rise in the USDX changing its price % for % in correlation. Thus the higher the USDX rises, the Lower the Bottoming and unbreakable Low in REAL DELIVERABLE Gold will correlate."
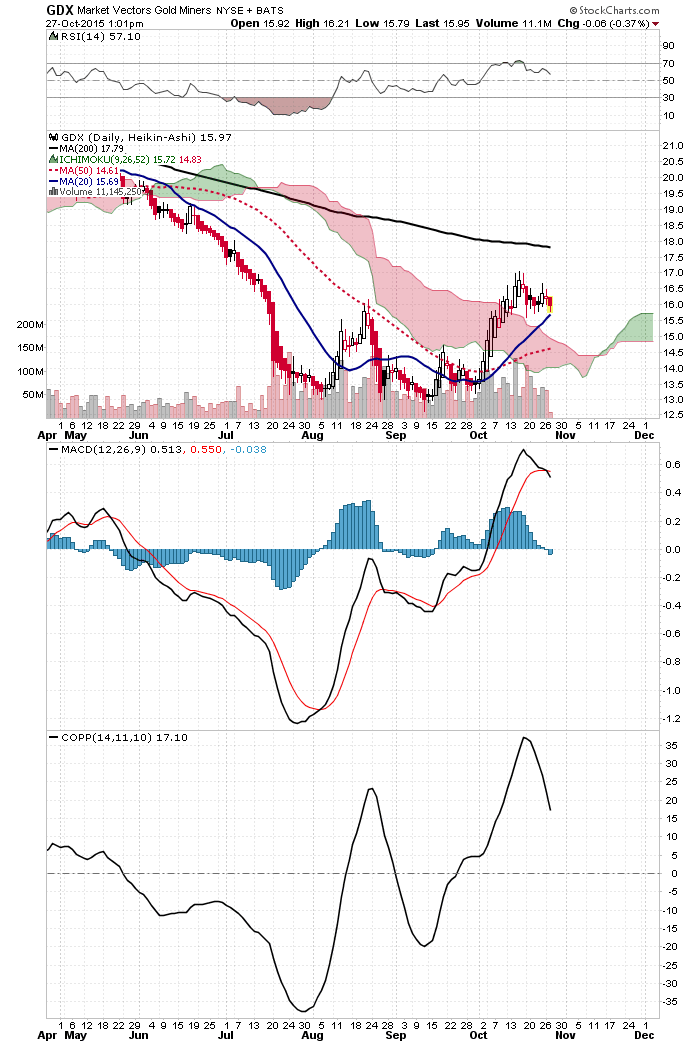
All the Moving Averages are in gear as the 20 & 50 move up towards their meeting with the 200.
RSI has fallen out of its Do-Not-Buy-Zone, and is bouncing around in open country (good).
The MACD continues to climb as does the Coppock Index (quite Long Term). Now lets move to
REAL DELIVERABLE GOLD METAL = MNT.To
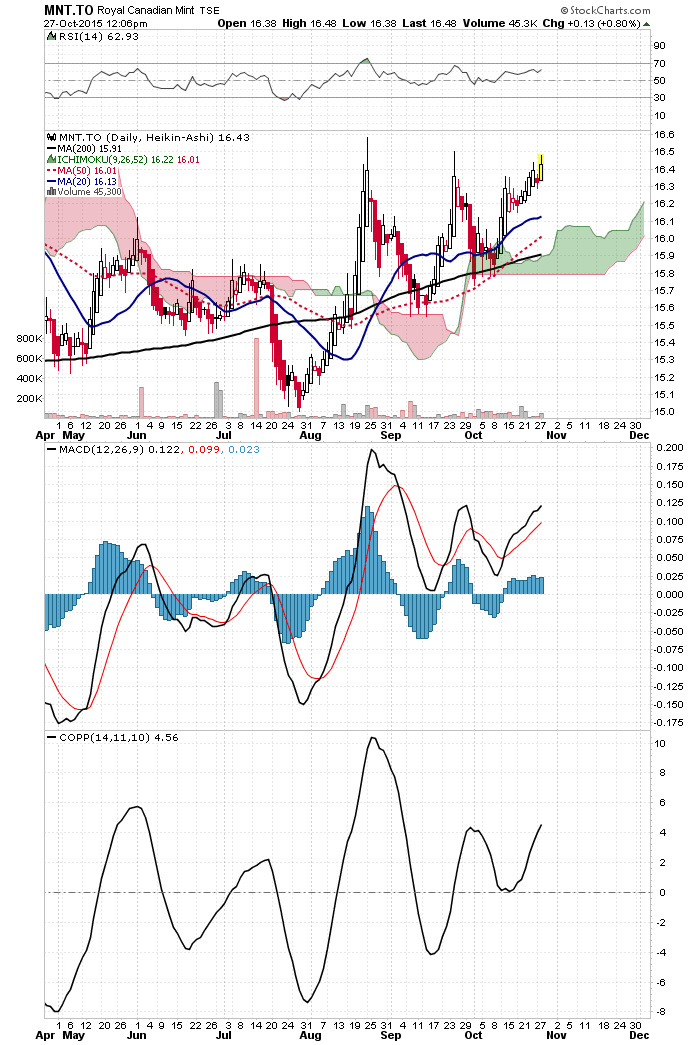
with that I say, TAKE A LOOK AT GOLD, and tell me it is not in an uptrend.......please. What is different here, is IT IS ABOVE its 200 Day Moving average.
'Nuff said, DYODD (do your own Due Diligence).
For me its "Hot" Chart. Was that not good enuf ?
Lets see what the LEADING MEASURE SAYS........
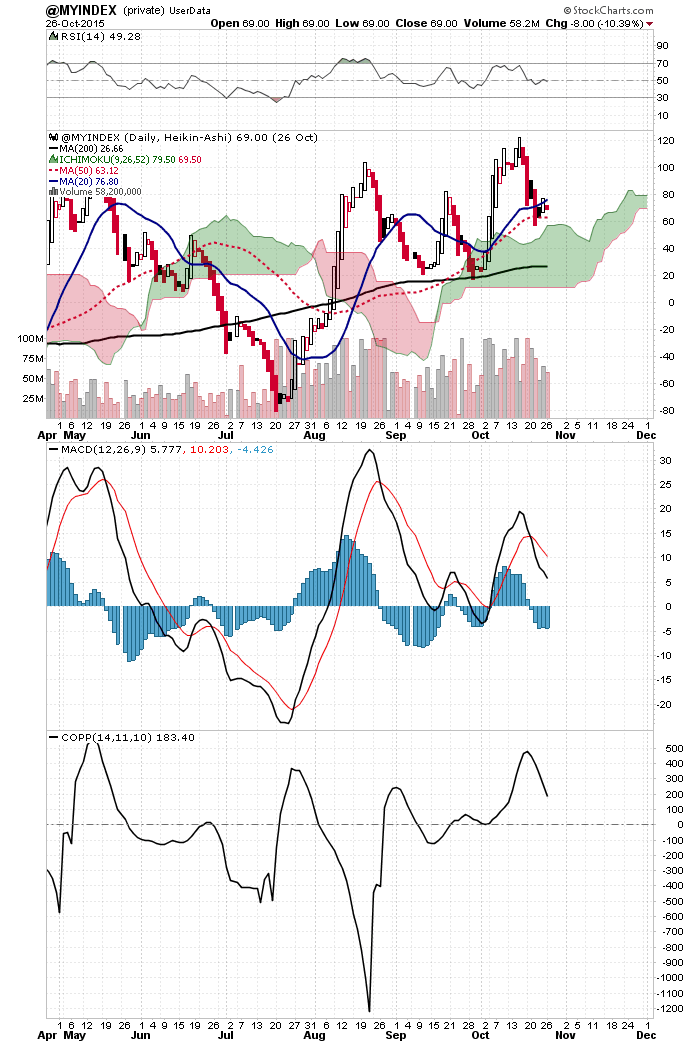
You and I have witnessed the KRIMEX take the contract paper price of NON-Deliverable (mandatory) fake Gold to any level they want by accepting the issuance of clearly bogus contracts by market interveners for what are clearly NON-PROFIT transactions, at the times of lowest volume in order to skew prices in the direction dictated by the agenda of the ESF, JPM and US Treas, as a matter of US Treas policy.
Should that type of attempted intervention appear here, arbitrage will drive it away since there will be a tangible profit to be realized and thus driven by profit, arbitragers will swamp the fake transaction and break the casino's bank.
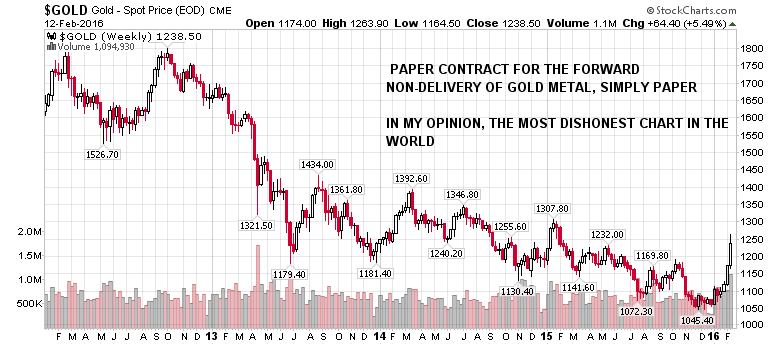
Now let's look at what I consider the most dishonest of Gold charts, showing Spot Gold as priced by the KRIMEX. Would you not say that it was not the greatest instruments of suppression and depression that you have seen compared with the Real Deliverable Gold. And like Fluoride if it is added to your water, there seems hardly a way to avoid it.
* CURRENT CHART * 2/12/2016
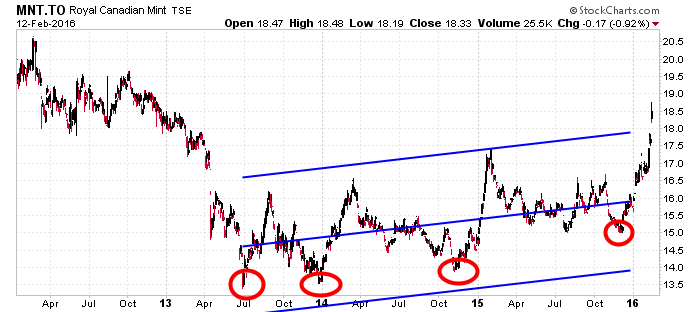
“ The Regression Channel Top will be the precise point at which the high days in a trend hit resistance and turn down,
and the low days will find support at the Regression Channel Bottom and turn up.
Finally, a day will arrive when price exceeds the Regression Channel Range and the trend is over. )”.
Thus we see in July of 2013 the downtrend ended. Shortly after, an uptrend started. From there you can follow the historical tracks of MNT.To. Same for the funny looking worm of Red and Green segments, the Ichimkomu Cloud. MNT.To has now chewed its way thru the resistance and is now atop a Green Support Cloud.
GET OUR RECO'S FIRST & FAST !
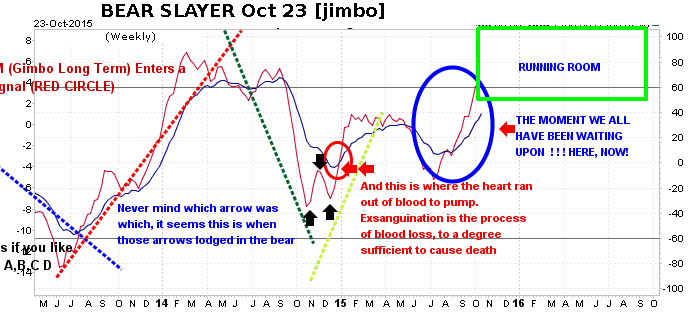
GOLD and probably most of the entire Precious Metals Complex (with the exception of the Platinum Metals Group) turned the corner back in June of 2013, but whichever forces opposed them saw fit to exert as much pressure as they could to mis-direct and mis-lead the public. What could have been their motivation ?
To grab most of the seats on this train? Possible. I have no real clue, but we can all guess, so as that is, I am happy if people recognize what to do NOW. In My Opinion, this is NOW a Bull Market for the Precious Metals Complex. What you do about it is a measure of you needs and savvy, but feel free to request a copy of PEAK PICKS (weekly) or the RECAP Report (monthly) free, via the Alert Group SignIn on the top of the sidebar.
By Denali Guide
http://denaliguidesummit.blogspot.ca
To the the charts involved, go here, to my Public Stock Charts Portfolio, and go to the last section. All charts update automatically. http://stockcharts.com/public/1398475/tenpp/1
© 2016 Copyright Denali Guide - All Rights Reserved
Disclaimer: The above is a matter of opinion provided for general information purposes only and is not intended as investment advice. Information and analysis above are derived from sources and utilising methods believed to be reliable, but we cannot accept responsibility for any losses you may incur as a result of this analysis. Individuals should consult with their personal financial advisors.
© 2005-2022 http://www.MarketOracle.co.uk - The Market Oracle is a FREE Daily Financial Markets Analysis & Forecasting online publication.


