


Silver Underperforms Gold in Early Stages of Bull Markets
Commodities / Gold and Silver 2016 Feb 22, 2016 - 06:11 AM GMTBy: Clive_Maund

 In the early part of Precious Metal bullmarkets, gold performs better than silver, but in the latter part silver outperforms gold. The reason is that the early part of bullmarkets in the sector are characterized by more serious and sober value oriented investors, whereas the latter part is characterized by momentum traders and speculators trying to make a fast buck, and they are attracted by the high leverage of silver relative to gold. This is the reason that the giant ramp in silver in the opening months of 2011 to a final parabolic slingshot peak in April - May signaled that it was all over, many months before gold itself topped out.
Even though gold has now signaled a new bullmarket with its recent breakout, silver is still underperforming and itself has barely broken out of its downtrend. This is because we are still in the very earliest stages of this nascent bullmarket, and momentum traders are elsewhere trying to make a fast buck. There is a positive flip side to this underperformance by silver, however, particularly when it has been going on for a long time, as is now the case, which is that it means that silver investments are cheap relative to gold investments and over a longer timeframe offer considerable leverage to them.
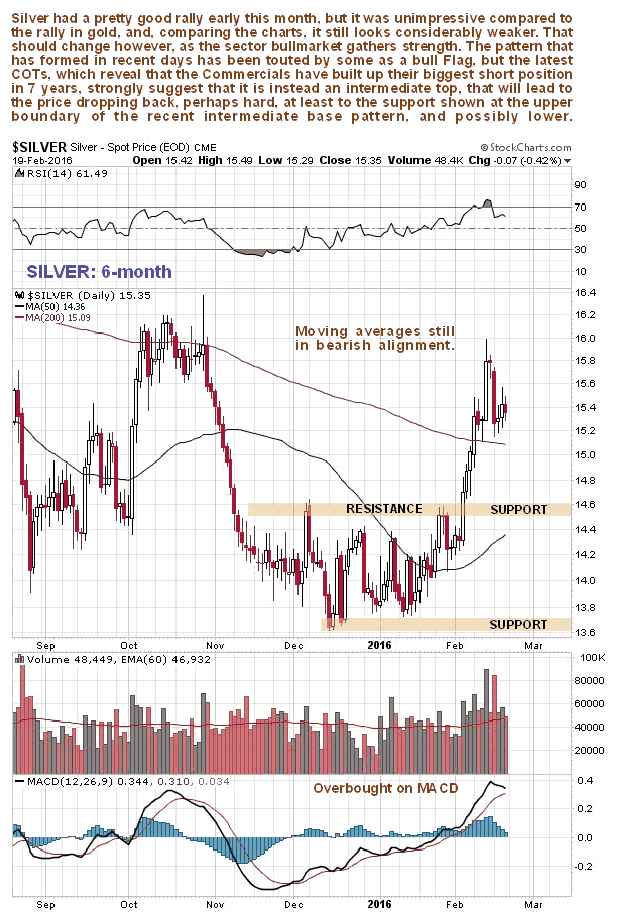
On silver's charts we can see the latest example of this underperformance of silver relative to gold. On its 6-month chart we can see that while gold has risen well above its October highs on its rally this month, silver has been unable to do likewise, and while gold has risen well above its 200-day moving average, which has turned up, silver has only risen a little above its still falling 200-day moving average, and is already spluttering with a big 7-year record Commercial short position having built up. This underperformance and high Commercial short position means that it is likely to get whacked on any correction. The silver charts look considerably weaker than those for gold at this point, which is normal in the early stages of a sector bullmarket. On a correction, which is believed to be imminent, silver is thought likely to drop back to the support in the $14.40 - $14.60 area near the upper boundary of its recent intermediate base pattern.
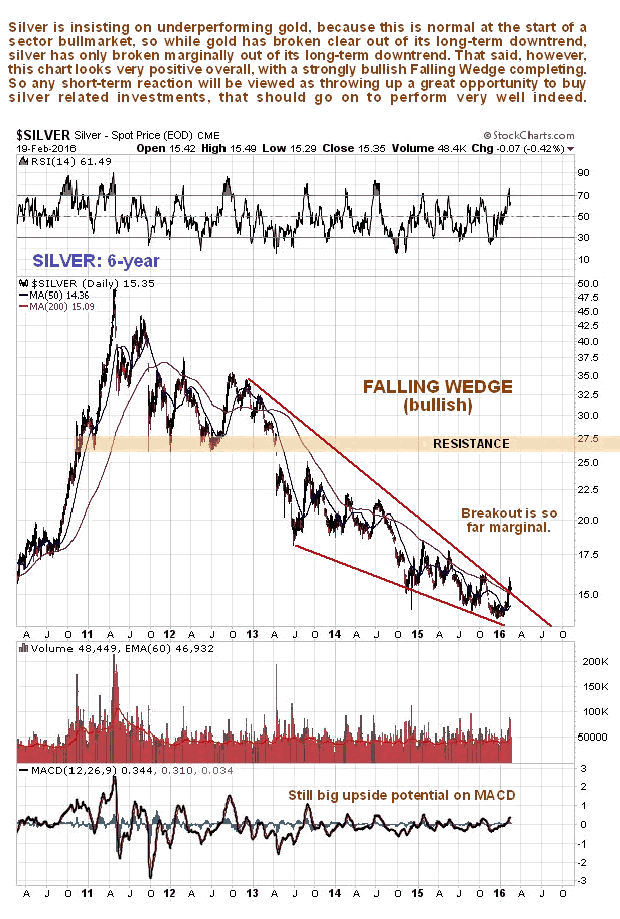
Turning to the long-term 6-year chart we can see again silver's weakness relative to gold. While gold has broken clear out of its major downtrend, silver has dragged its feet and barely broken out of its major downtrend. That said, however, the pattern shows great promise, with a quite strongly converging pattern closing up. So once it does get moving we should see some impressive action.
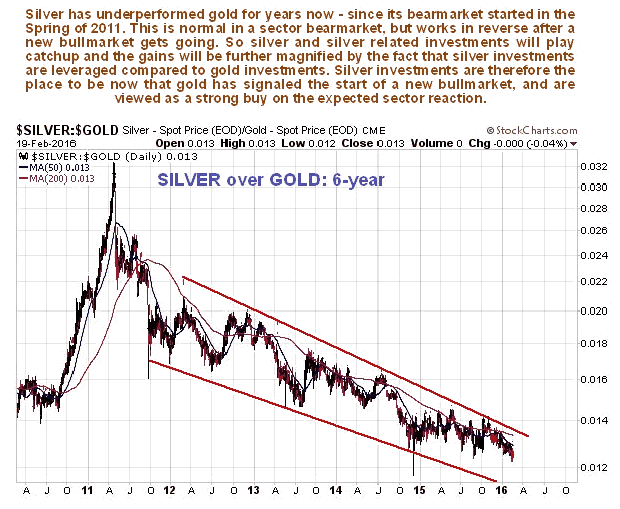
It's worth plotting the underperformance of silver relative to gold going back years, because the longer it goes on, the bigger is the potential for silver to catch up with gold again, and in the process reap big gains for investors in silver and related ETFs and stocks, which is why we are so interested in it. As we can see on the 7-year chart for this ratio, silver outperformed gold dramatically during the latter part of the prior bullmarket in 2010 and early 2011, which was a sure sign that the party would soon be over. Now the pendulum has swung to the other extreme, alerting us to the fact that while silver investments may be grudgingly advancing with gold at this point, once the sector uptrend gains momentum they will really come to life and catch up with gold investments, before proceeding to outperform again. This is why it's worth scratching around for bargains here, and especially when silver gets whacked backed again soon, which COTs indicate is a high probability.
Now we come to the "real fly in the ointment" (I'm trying to put it politely here), which is the latest COTs for silver. They show the biggest Commercial short position since 2008. While you can seldom be 100% sure of anything in this business, these readings indicate a high probability that silver is putting in an intermediate top here and will soon get beaten back, at least to the support at the upper boundary of the recent base pattern, and possibly lower.
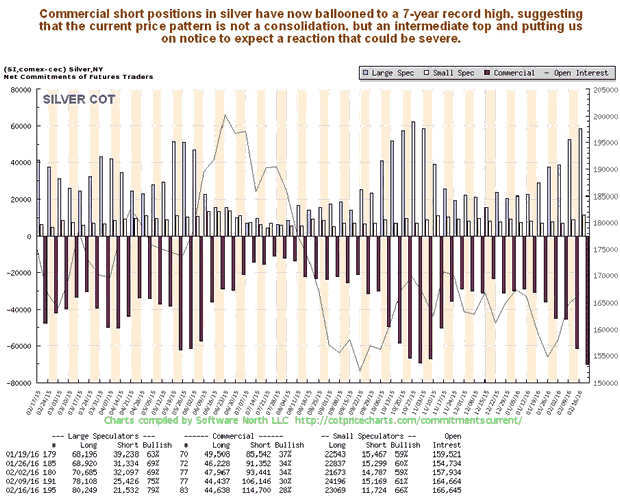
The long-term silver Hedger's chart, which is another form of COT chart, reveals that Hedger's positions are at their most negative since 2008, which is viewed as a warning to expect a drop soon. These positions definitely have bearish implications.
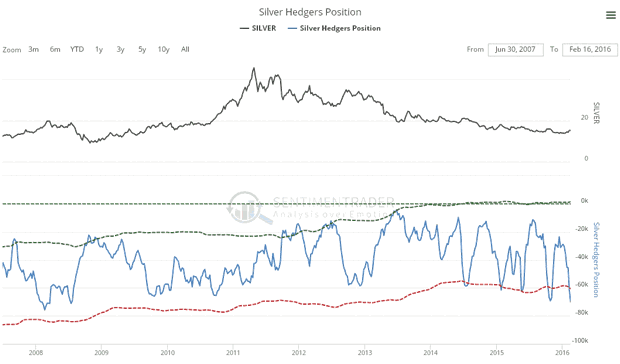
Chart courtesy of www.sentimentrader.com
Finally the silver Optix, or Optimism chart, reveals that optimism towards silver is high at this point, near to all the peaks of the past year, meaning that there is a high probability that it will turn down, which means that there is a high probability drop silver will drop back from here.
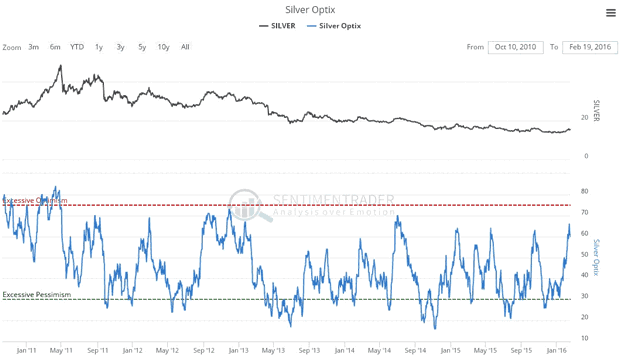
Chart courtesy of www.sentimentrader.com
By Clive Maund
CliveMaund.com
For billing & subscription questions: subscriptions@clivemaund.com
© 2016 Clive Maund - The above represents the opinion and analysis of Mr. Maund, based on data available to him, at the time of writing. Mr. Maunds opinions are his own, and are not a recommendation or an offer to buy or sell securities. No responsibility can be accepted for losses that may result as a consequence of trading on the basis of this analysis.
Mr. Maund is an independent analyst who receives no compensation of any kind from any groups, individuals or corporations mentioned in his reports. As trading and investing in any financial markets may involve serious risk of loss, Mr. Maund recommends that you consult with a qualified investment advisor, one licensed by appropriate regulatory agencies in your legal jurisdiction and do your own due diligence and research when making any kind of a transaction with financial ramifications.
Clive Maund Archive |
© 2005-2022 http://www.MarketOracle.co.uk - The Market Oracle is a FREE Daily Financial Markets Analysis & Forecasting online publication.