


Gold And Silver – February Heralding End Of Down Trend?
Commodities / Gold and Silver 2016 Feb 27, 2016 - 08:55 AM GMTBy: Michael_Noonan

 Applying market logic:
We often state that the market is replete with logic, even for those who do not know how or do not like to look at charts to explain the markets. Charts that explain developing market activity have been superior to all fundamental analysis over the last several years. For us, that statement would include for as long as charts have been maintained, starting with Japan’s rice market, a few hundred years ago.
Most market participants have some [unrequited] need to have fundamentals be the driving force behind their market comprehension. [See the stock market top from 2008 and the ongoing follow-up by fundamentalists who were unable to comprehend how their world of value investing had just been turned upside down. As an aside, charts were flashing a major sell signal after the top but well before the collapse]. We digress…not really. The point is valid.
There have been many calls over the past few years for a bottom in gold and silver, yet none ever materialized. Just like in advertising, the same old products are repackaged as “new and improved,” those so-called gold/silver pundits simply ignore their past and call for yet another bottom. People have short memories, except for when their accounts have suffered from believing and acting upon past false calls, and everyone is hungry to be among the first to participate in the final bottom that begins a trend reversal.
We are putting ourselves out as viewing February as perhaps signaling a potential turn in trend for gold and silver, and if true, it would mark December 2015 as a bottom. We leave the door open for the possibility of yet another new low, not as wiggle room or talking out of both side of our mouth, as it were, but regular readers of our commentaries know we like to see confirmation of any market call. Without confirmation, there can be no change, and to date, there has been nothing to confirm a bottom in PMs.
The significance of February is its decided change in market behavior on the monthly and weekly charts. The significance of the monthly and weekly charts is that both are more controlling for trend direction and, as a consequence, require more time to turn. Neither are used for market timing, the daily serves that purpose. If there is to be a change in trend, it will show up on the daily before the weekly and monthly.
While we have been reluctant to say the daily has identified a bottom for gold and silver, by the close of February, [this is Friday, the last trading day is Monday], both the monthly and weekly charts reveal a story that could not have been told prior to what has occurred this past month.
We have acknowledged that the fundamentals overwhelming support a bull market for gold and silver, beyond question. We have also stated that fundamentals do not apply, at least in terms of market timing, to reflect that overt bullish outlook. All fundamentals have taken a back seat to the elite’s central bankers that have been actively manipulating and suppressing the price of gold and silver at least since the 1960s, and not just over the past several years. What has been a far more accurate barometer for gold and silver since the market peak in 2011 than charts?
Many presume we are technical analysts. We are not. You never see moving averages, RSI discussions, conventional trend lines that keep changing when they cease to work, MACD, whatever that is, Bollinger Bands, etc, etc, etc. All are based on past tense market activity and imposed onto present tense market activity as a means for “predicting” future tense market activity. Many, if not all, have a similar consistency of a stopped clock: right twice a day with pinpoint accuracy but no so reliable on other occasions.
We read and interpret the market based upon the market’s own generated information using price and volume, over time, on the premise that there is no better an accurate source of information than that provided by the markets. Some, maybe most, see that as a distinction without a difference. If so, then why the total absence of standard tools for technical analysis, as just described?
The markets are full of logic. The objective is to read and perceive what that logic may be, for it is not always clear. For those times when it is not always clear, that is the market’s logic to say, stand aside or use a lot of caution before proceeding. The most important piece of market logic is knowing and identifying the trend, for that is the prevailing direction of the market, and one can be more profitable by trading in harmony with the established trend.
A subsidiary aspect to knowing the trend is to realize that they take time to turn, as those who have been waiting for a turn over the past few years can recognize or appreciate. Here is our interpretation of the market’s logic using the results from February’s market activity.
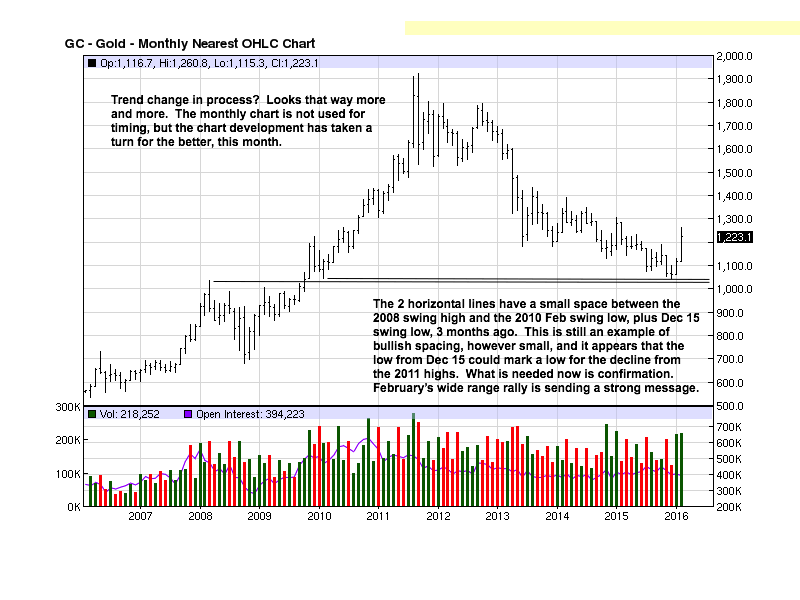
For the past few years, we have mentioned bullish spacing as a characteristic trait of a trending market. We have identified it since 2013, and the spacing has slowly been getting smaller and smaller over time. You can see from the chart below that it has narrowed to a point of almost disappearing, but it is still there. The fact that the spacing was not eliminated speaks for its strength as a market measure: sellers were unable to erase it, at least up to this point. [Everything in the market is subject to change.]
When bullish spacing was nearly eliminated in December 2015, note how small the bar was and how volume declined. The fact that the bar was small is the market telling us that sellers did not have the ability to move the market any lower and at a point in time when sellers have been in total control. Then, note how volume diminished. It was the lowest sell volume [red bar], since 2009. That is a message from the market.
The logic is clear. Sellers could not close out the bullish spacing evident by a small range bar at a recent market low and when volume was not there to drive price lower. While the logic is clear, does that mean one should act upon it and be a buyer? Absolutely not. That apparent support could still fail, as it did in four preceding swing lows. Then what is the point for that information? Excellent question.
Confirmation is the point. The four preceding swing lows were not confirmed. They were not validated, and knowing that the trend, the prevailing market momentum is down, it is foolhardy to trade against the trend and increase one’s risk exposure. The point of acknowledging February’s activity is that is has an increased probability of confirming that the December low could be the bottom. What could increase that probability to a certainty?
Confirmation that the next correction holds above the December low.
Not a lot of people appreciate the value of knowing and heeding the trend. The next most important piece of information is knowing that one move confirms [validates] the prior move. It is the market’s way of keeping yourself in the most advantageous position to profit from developing activity. See comments on monthly chart.
Here is an important market message that has increased the probability that February could indicate a market in the process of turning direction. Not once in the prior months do you see a swing high higher than the previous swing high. This is again applying simple logic from the activity generated by the market that is sending a message for the first time in the past few years.
In order to determine if February is a valid indicator for change, it, in turn, has to be validated by developing market activity taken from the daily chart.
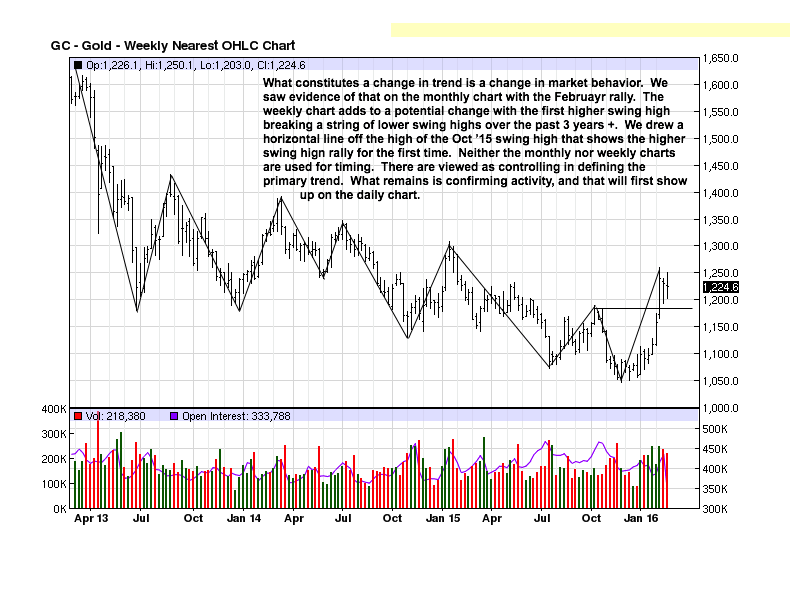
While the daily chart has shown a short-term up trend, the higher monthly and weekly time frames did not support the message. We state that a change in trend will appear on the daily chart before the weekly and monthly charts. Prior to February, there has been no clear indication of a trend change on the daily. Now, after the fact, the recent rally on the daily takes on more significance due to the new and just completed market-generated information on the weekly/monthly time frames.
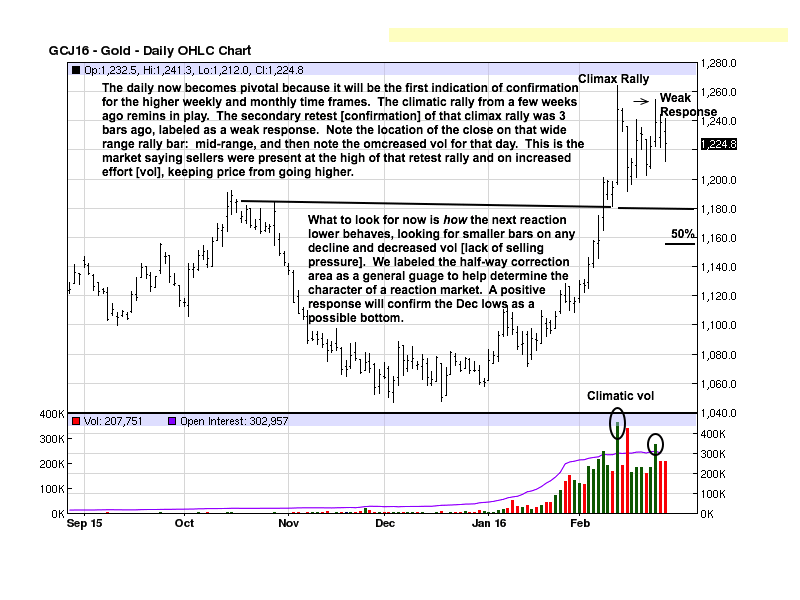
This is why we view the daily chart as pivotal, at this juncture, because the next reaction lower could confirm the read of February’s developed activity on the higher time frames. If confirmed, one can then develop a trading strategy to be in harmony with what may be the beginning of higher prices to come.
What to look for?
Will the next reaction stay above a 50% retracement level, a general sign of strength? Will the reaction lower be comprised of smaller range bars [= less control by sellers], and less volume [= less pressure from sellers]? If yes, the market is telling us that sellers have lost control. Buyers will recognize that and start to become more aggressive. When that happens, the supply/demand equation kicks in, and higher prices result.
The gold:silver ratio has reached 81+:1, where it takes 81+ ounces of silver to buy one ounce of gold. This is reflected in the slightly weaker chart structure for silver relative to gold. It is for this reason we have favored buying silver over gold because 80:1 gold over silver has not been self-sustaining for long periods of time. The ratio may continue to increase, just as the price for gold and silver continued to decline, despite the fundamentals, but the ratio does not have proven staying power above 80:1. The probability grows that, at some unknown point, the gold:silver ratio will turn in favor of silver.
Over time, we expect the ration to turn back to 40:1, perhaps even lower. At 40:1, it then only takes 40 ounces of silver to purchase one ounce of gold, down by half over the current ratio. At 80:1, 10 oz of gold buys 800 oz of silver. At 40:1. the 800 oz of silver can now buy 20 oz of gold. [Transaction costs not included for sake of example]. One can double one’s gold holding over a period of time just by strategically switching one metal for the other, is the point.
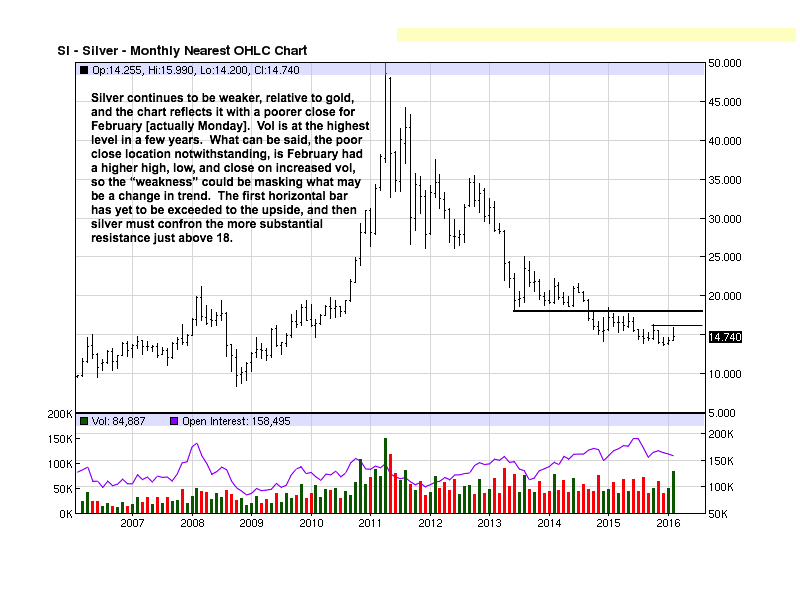
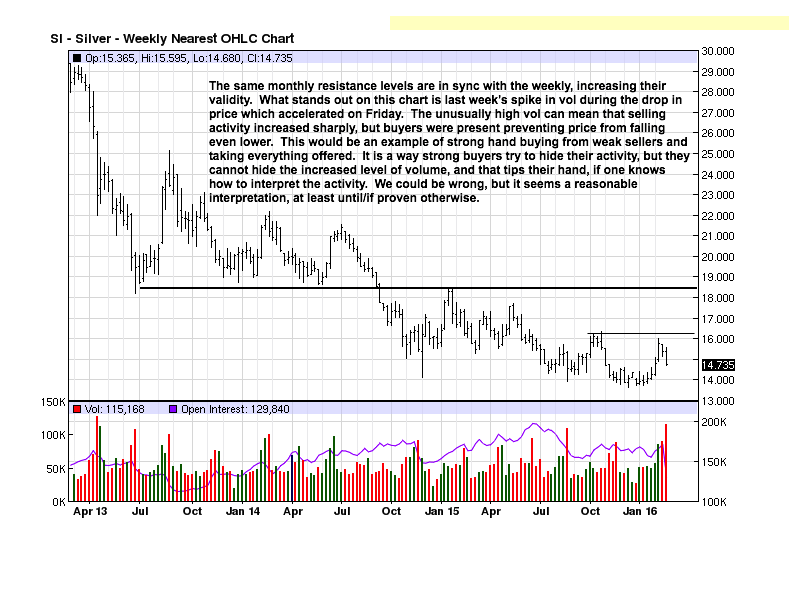
February’s [red] volume bar is the highest since May 2013. Note how wide the range of the down bar was in May 2013 relative to how much narrower the range is for February. Here is a clear example, [applying logic] of sellers in total control in May 2013, but buyers are clearly present in February 2016, thus preventing the price range from extending lower, another example of a message from the market and why market-generated information is always more pertinent and present tense.
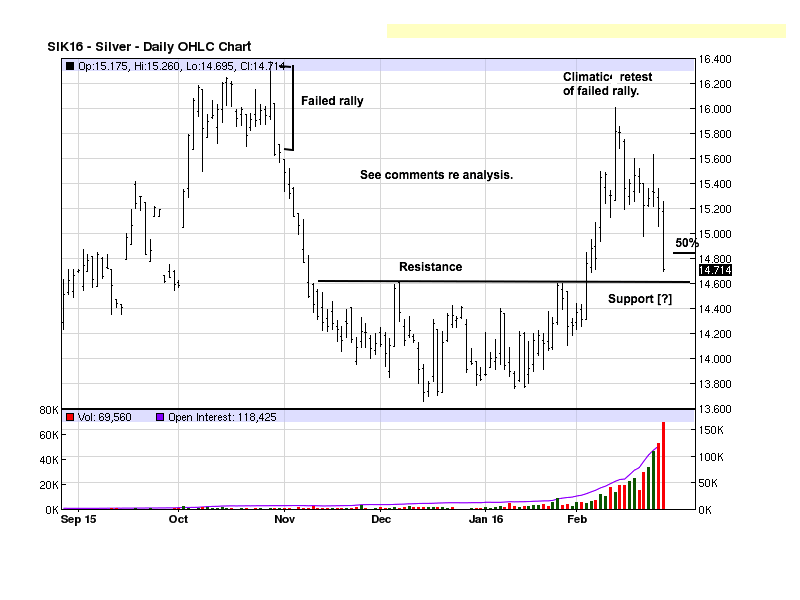
There was a failed rally in October 2015. The failed climatic rally, which we identified as such, a few weeks ago when it occurred, was confirmation of the October failure. This is another example of how one move can confirm a prior one. [Markets are always testing and retesting past support/resistance and high volume areas.]
Silver being weaker relative to gold is evident where gold is holding above its current 50% retracement level, and silver has declined slightly below its half-way retracement, typical of a weaker market. In gold, we said to look for narrower bars down on any reaction and on declining volume. What we see in silver is the exact opposite: a large wide-range bar on increased volume.
Reading developing market activity is more of an art form and not absolute. Appearances can be deceiving. Smart money [controlling influences] like to hide their intent to not have any competition. Because smart money moves [buys/sells] such large positions, at times, volume is a dead giveaway. Small traders do not create large volume increases; only large market movers do…this is axiomatic.
Large volume typifies a change from weak hands into strong. It is where you see small traders react to what conditions smart money are creating, especially at swing turns and changes in trends. This could be where the large volume is masking the intent of what the market is conveying. Where large ranges down with a poor close on increased volume portends continuation lower, at times, smart money can be creating the move lower but is buying every contract offered from weak-hand sellers and sell stops in order to facilitate their need to buy a market at/near lows. This is how they function.
We could always be wrong in trying to determine the logic of reading developing market activity, for it is an art and not pro forma. If wrong, the market activity will not confirm the potential December low and no harm done, [because one waits for confirmation before taking action.
This analysis applies more to the paper market, for we have been strong advocates of buying physical gold and silver at any price, and especially at these low levels. We cannot know when the downside manipulation will end, and when it does, the released pressure should have an equal and opposite reaction to the upside, the unintended consequences of the elite’s desire to keep the public out of the gold/silver market.
Buy the physical without concern for price. One day, this price will be unavailable, and the possibility exists that any future physical gold/silver will be unattainable. It could happen.
By Michael Noonan
Michael Noonan, mn@edgetraderplus.com, is a Chicago-based trader with over 30 years in the business. His sole approach to analysis is derived from developing market pattern behavior, found in the form of Price, Volume, and Time, and it is generated from the best source possible, the market itself.
© 2015 Copyright Michael Noonan - All Rights Reserved Disclaimer: The above is a matter of opinion provided for general information purposes only and is not intended as investment advice. Information and analysis above are derived from sources and utilising methods believed to be reliable, but we cannot accept responsibility for any losses you may incur as a result of this analysis. Individuals should consult with their personal financial advisors.
Michael Noonan Archive |
© 2005-2022 http://www.MarketOracle.co.uk - The Market Oracle is a FREE Daily Financial Markets Analysis & Forecasting online publication.