


Stocks Bear Market Rally or Not?
Stock-Markets / Stock Markets 2016 Mar 13, 2016 - 04:09 PM GMT

 Everyone wants to really know if this is a bear market rally or will it make new all time highs on the SPX. It's been a while since I wrote an article, but in my last article I was looking for a minor new high for the SPX. To end the bull market that started from 2009. We never did see that, although we did see a new bull market high on the NDX.
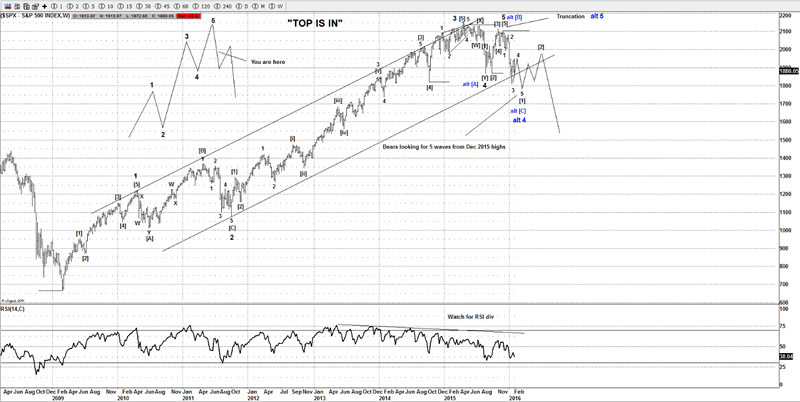
Into the February 2016 lows when most were bearish and calling for the end of the world, we were counting the decline as the end to either wave [1] of a larger bear market cycle or it could have been a [C] wave an alternative idea we are still tracking, which still supports a move to new all time highs, although based on the NDX I am still liking the idea this is probably a bear market rally currently labeled as wave [2] as shown.
Before
S&P500 Daily Before Chart
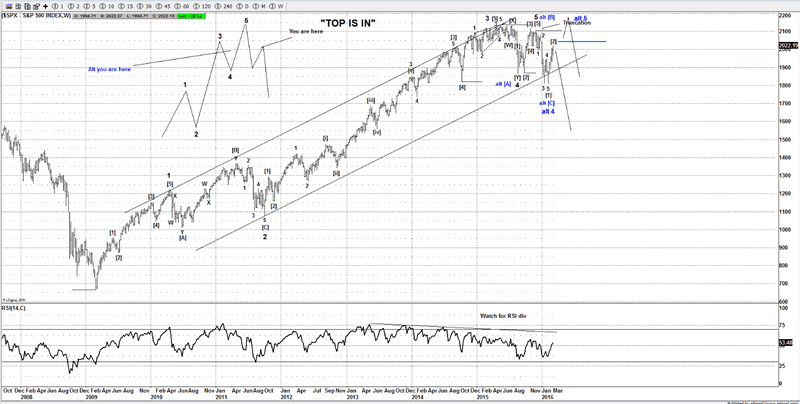
After
S&P500 Daily After Chart
So I am asking myself the question. Was that the end to the bull market? We got the expected bounce that we wanted, that was the easy bit, the hard bit is to work out if the market is still going to make new all time highs, or will it rollover and now continue lower under 1800?
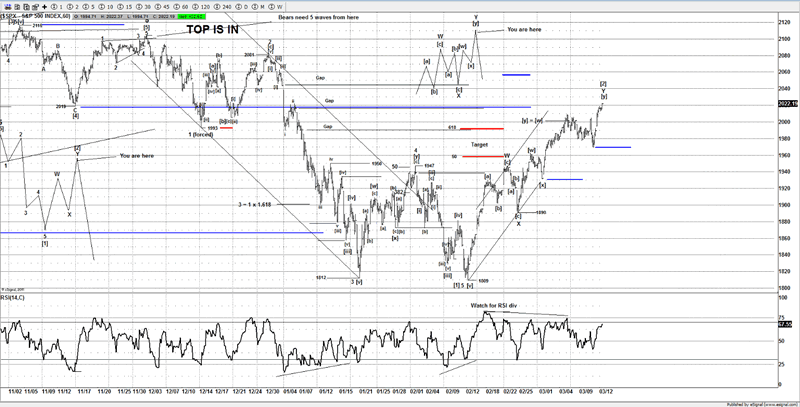
When I look at the internals of the rally from the Feb 2016 lows I can count a very clean looking WXY structure and at Fridays high it counts virtually completed.
SPX
S&P500 60-Minute Chart
Whilst you can possibly count the SPX as part of some sort of impulse wave the look on the NDX is a problem for the bullish case, the structure is much sloppier on the NDX and really argues the case that the rally is a bear market rally against the Dec-Feb decline.
NDX
NASDAQ 60-Minute Chart
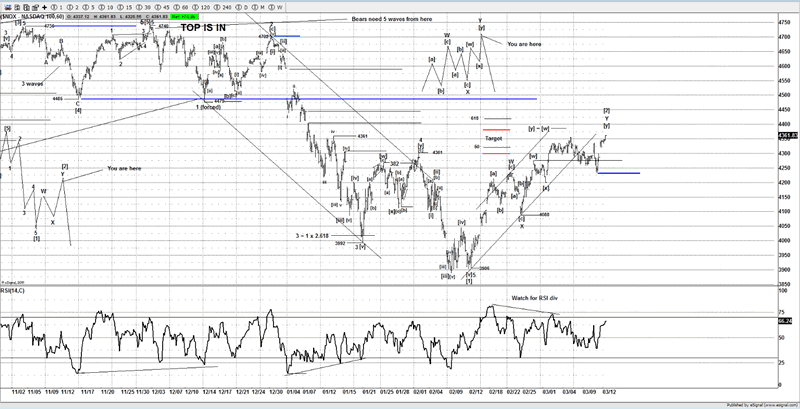
A strong break back under Thursdays low would help the bearish case. Going into next week I am looking for a strong reversal and a break under 1970SPX to support a bearish reversal, the NDX will need to see a solid close back under 4260 to find sellers. Whilst I can't rule out seeing new all time highs, I think this is a very similar setup to that of the rally we saw in March-May 2008. Back then the SPX tested its 200DMA around 1440 if I remember correctly and reversed hard. With the SPX testing its 200DMA things may turn nasty for the bulls next week.
If for any reason the market did see new all time highs, it will simply delay the inevitable bear market that is setting up as the weekly chart would complete the alt idea we are watching (shown in blue) as the end to a 5th wave from the March 2009 lows.
Until next time,
Have a profitable week ahead.
Click here to become a member
You can also follow us on twitter
What do we offer?
Short and long term analysis on US and European markets, various major FX pairs, commodities from Gold and silver to markets like natural gas.
Daily analysis on where I think the market is going with key support and resistance areas, we move and adjust as the market adjusts.
A chat room where members can discuss ideas with me or other members.
Members get to know who is moving the markets in the S&P pits*
*I have permission to post comments from the audio I hear from the S&P pits.
If you looking for quality analysis from someone that actually looks at multiple charts and works hard at providing members information to stay on the right side of the trends and making $$$, why not give the site a trial.
If any of the readers want to see this article in a PDF format.
Please send an e-mail to Enquires@wavepatterntraders.com
Please put in the header PDF, or make it known that you want to be added to the mailing list for any future articles.
Or if you have any questions about becoming a member, please use the email address above.
If you like what you see, or want to see more of my work, then please sign up for the 4 week trial.
This article is just a small portion of the markets I follow.
I cover many markets, from FX to US equities, right the way through to commodities.
If I have the data I am more than willing to offer requests to members.
Currently new members can sign up for a 4 week free trial to test drive the site, and see if my work can help in your trading and if it meets your requirements.
If you don't like what you see, then drop me an email within the 1st 4 weeks from when you join, and ask for a no questions refund.
You simply have nothing to lose.
By Jason Soni AKA Nouf
© 2016 Copyright Jason Soni AKA Nouf - All Rights Reserved
Disclaimer: The above is a matter of opinion provided for general information purposes only and is not intended as investment advice. Information and analysis above are derived from sources and utilising methods believed to be reliable, but we cannot accept responsibility for any losses you may incur as a result of this analysis. Individuals should consult with their personal financial advisors.
WavePatternTraders Archive |
© 2005-2022 http://www.MarketOracle.co.uk - The Market Oracle is a FREE Daily Financial Markets Analysis & Forecasting online publication.