


Coffee Price Downtrend Set To End
Commodities / Coffee Mar 15, 2016 - 12:07 PM GMTBy: Austin_Galt

 The coffee price has risen from its lows and this could well be the start of the expected big rally which has been laid out previously. Let's review the daily chart and monthly charts.
Coffee Daily Chart
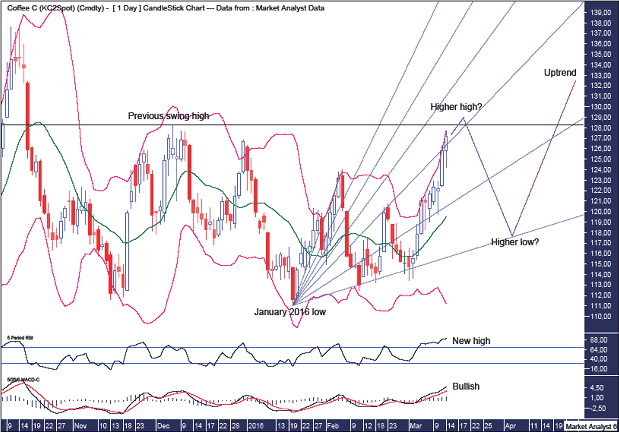
We can see price has been moving up nicely since the January 2016 low at $112.53. To really gain confidence that a new bull trend is in play the price needs to crack above the previous swing high level which stands at $128.30 and is denoted by the horizontal line.
The Bollinger Bands show a lot of bouncing up and down between the upper and lower bands and price now looks to be surging higher as it hugs the upper band. Once a higher high is in place then I would expect a move back down to the lower band to set up a higher low.
I have drawn a Fibonacci Fan from the low to first high. This shows price finding support back down at the 88.6% angle. Price is now around resistance from the 61.8% angle and the perhaps price will climb up a bit more along this angle or even surge up to the 50% angle before correcting. And perhaps after a new swing high price will once again come back to the 88.6% angle to put in a higher low. Let's see.
The RSI is overbought so perhaps we are nearing the end of this leg up. Also, this RSI reading has made a new high which is generally bullish in that after a correction it would be normal to expect price to trade back up to new highs while the RSI makes lower highs thereby setting up once or more bearish divergences.
The MACD indicator is bullish and is looking strong by making new highs also.
Let's now review the bigger picture using the monthly chart.
Coffee Monthly Chart
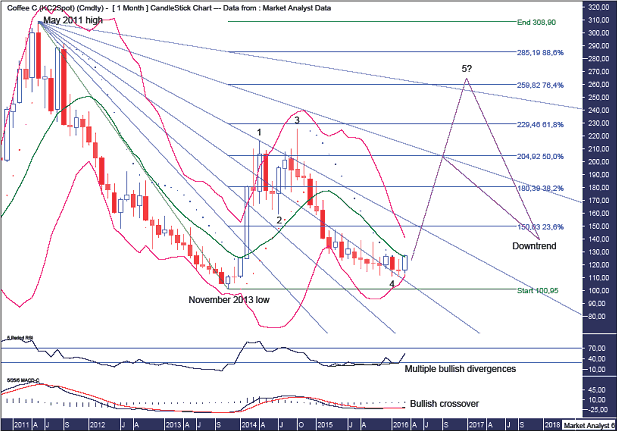
The RSI is showing multiple bullish divergences at the recent low while the MACD indicator has just made a bullish crossover. Nice.
The PSAR indicator is bullish with the dots underneath price.
The Bollinger Bands look to be tightening and price is already back at the middle band. I'd expect some work to be done around this middle band before price sets sail for the upper band and continues higher as it highs that band.
There looks to be a 5 point broadening top in play denoted by the numbers 1 to 4 with the point 4 low now in place. This is actually a 7 point broadening top if one looks at the daily chart. These patterns are just a picture of human behaviour which continually repeats.
Assuming the point 4 low is now in place, then price should trade above the point 3 high which was set in October 2014 at $225.50. If I am wrong and the point 4 low is still to come then a lower high should form below the point 3 high.
I have drawn a Fibonacci Fan from the May 2011 high to November 2013 low. This shows the recent point 4 low around support from the 50% angle and the next angle of resistance will be the 61.8% angle which is still a bit higher. Perhaps the final point 5 high will be around resistance from the 88.6% angle while a lower high only might be around the 76.4% angle.
I have added Fibonacci retracement levels of the move down from May 2011 high to November 2013 low and I favour a point 5 high to form around the 76.4% level which stands at $259.82. If I am wrong and a lower high only is made then the 50% level at $204.92 will be one to watch.
So, whichever scenario unfolds, a solid move higher now looks in its infancy.
By Austin Galt
Austin Galt is The Voodoo Analyst. I have studied charts for over 20 years and am currently a private trader. Several years ago I worked as a licensed advisor with a well known Australian stock broker. While there was an abundance of fundamental analysts, there seemed to be a dearth of technical analysts. My aim here is to provide my view of technical analysis that is both intriguing and misunderstood by many. I like to refer to it as the black magic of stock market analysis.
Email - info@thevoodooanalyst.com
© 2016 Copyright The Voodoo Analyst - All Rights Reserved
Disclaimer: The above is a matter of opinion provided for general information purposes only and is not intended as investment advice. Information and analysis above are derived from sources and utilising methods believed to be reliable, but we cannot accept responsibility for any losses you may incur as a result of this analysis. Individuals should consult with their personal financial advisors.
Austin Galt Archive |
© 2005-2022 http://www.MarketOracle.co.uk - The Market Oracle is a FREE Daily Financial Markets Analysis & Forecasting online publication.