


S&P Stock Market Index 400 Point Move!
Stock-Markets / US Stock Markets Jul 14, 2008 - 03:30 AM GMTBy: Dominick
 What if that was the headline for this coming week, a four hundred point move in the S&P? Most likely, you'd be loading up on out of the money puts or calls , looking for the market to close at record highs or down around 800. If you haven't noticed, those looking for a sudden, dramatic collapse in stocks have been thwarted by a slow, persistent drip downward occasionally punctuated by vicious snapback rallies.
But what if I told you the S&P 500 did move 400 points? Just last week in fact. Sure, on a closing basis we're lower by just 16, though it feels like 1600. Not counting tiny wiggles, though, all the larger moves on an intraday 15-minute chart from last week add up to about 400 points. That's more than if you shorted the top tick at 1440 three months ago, or even the all-time high back in October, almost a year ago.
Realistically, it's very unlikely that many shorted that record high, and if they did, those have all been shaken out long ago by now. Most professional money managers would kill to have just a piece of that total move from October, which measures to about 345. Yet unbiased traders who aren't trying to hit a home run are making big money taking 60-70% of those points or more every week. No, it's not easy, but at TTC, that's what we do!
Now that we've closed our doors to new retail membership, existing members have had the opportunity to acclimate themselves to our trading style and learn our proprietary indicators and targets. They've learned to stop counting a volatile market. But even more importantly, they've learned to stop trying to catch a bottom or a top and just trade.
So, with that in mind, looking at our longer term charts for the next big idea going into this week, there are several factors that seem to be lining up to produce a tradeable bounce and the last thing we want to do is be short into it. But make no mistake, the bears have the upper hand after taking out the March low and if there isn't at least some type of decent rally soon, this market could finally be ready to go lower in a big way.
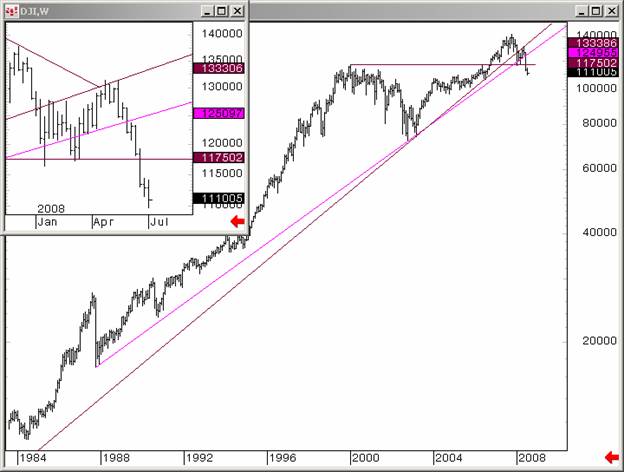
The chart above has been a main focus of ours all year as we've watched the Dow interact with two major trendlines stretching back to the 1980s. Yes, the market could continue its decline from here – everything can continue to go wrong as it did last week with the market ignoring major projected cycle bottoms and losing support even after a clear five waves down. But, being unbiased means we have to keep in mind the idea that we at least get a kissback here, possibly even to one of the major trendlines. And given the other corroborating factors described further in this update, risk/reward would seem to favor some strenght in the market here soon. 11750 in the Dow will again be an important deciding area on any rally that gains momentum.
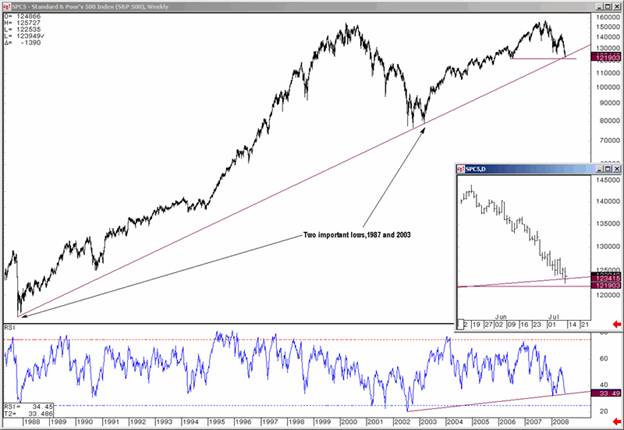
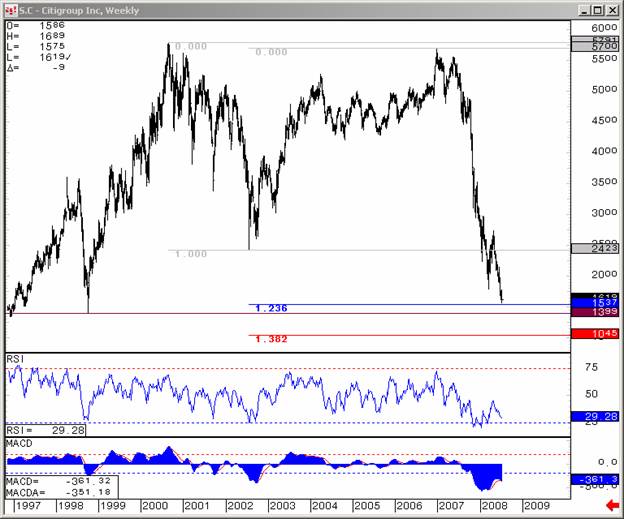
The chart above is a clear indication of potential support working in this area. We had 1440 as a crucial test even as we were starting our ascent off the March lows. And, after finding resistance there to the tick, we looked for support at 1333 and 1256, both of which have failed. But our plan all along to see the S&P hold up as the banking index completed five waves down with new lows. While the chart above shows the S&P reaching strong potential support at multi-year trendlines, the chart below shows Citigroup at or near a bottom. The “flat” wave pattern C is trying to complete and can end immediately or extend as low as the 1.382 extension. What is certain is that a bottom in the banks will translate into a powerful rally, even if short lived, in the major stock indices, and, again, the last thing we want to do is to be short into something like that!
Another major factor that could be contributing to a tradable rally in the very near term is oil. Of course, oil has been watched by everyone and has been one of the major headwinds in this market. Having clearly gone parabolic some time ago, the move in oil now looks overdone and when it breaks, it can break hard and fast. Like a bottom in the banks, a top in oil could have profoundly bullish implications for the broader market. My chart and targets have to be reserved for members, but believe you me there is a trade here that can make your entire year, and fast. At TTC we've traded both sides of this market from $123, but are now looking for short entries. If what we're watching is correct, the TV is going to soon shift its focus from $150 oil to $100.
And finally, there's sentiment, which has become awfully, horribly bearish. It may not be reflected in the VIX because of the orderly nature of the decline, but believe you me that many people are short this market and getting complacent even as the fact that nothing worked in the market last week, combined with the other factors I've described, suggests the possibility of at least a short term low. And, as I've said, there's still a chance that our dip below 1256 is still a minor poke if we get a recovery soon next week. You know now the market and areas we will be watching for confirmation of this idea. If not, then look out below because there's no more room for the bulls to extend lower for another week like we've been seeing. The biased bears have finally gotten a chance to short blindly and be right, but this is rare and doesn't last forever. The unbiased traders have made money on the downside and have no illusions going into next week.
Institutional traders , if you're ready to get on the team that makes money no matter what the market environment, then maybe it's time you joined TTC.
Long time readers will remember that after two years of growing our membership through consistently accurate and tradable market analysis, we closed our doors recently to focus on our existing membership, largely institutional traders, and give them a chance integrate our approach into their trading. Old habits don't change overnight, and it usually takes weeks if not months for new members to start making consistent gains with the resources offered at TTC. We are a serious group of dedicated traders with only one mission: to trade profitably. Those that take the time to learn our methods are very happy they did.
Retail traders , if you missed the chance to join earlier this year, do not hesitate to click here and register for the waiting list with no obligation at all. In the very near future we will be providing the first opportunity for membership from that list.
In the meantime, be careful out there. Be aware of what the charts are saying in multiple markets and tune out the TV. Don't be afraid to take high risk/reward trades, but be ready to cut your losses quickly if it's wrong. But most of all, be unbiased.
By Dominick , a.k.a. Spwaver
www.tradingthecharts.com
This update is provided as general information and is not an investment recommendation. TTC accepts no liability whatsoever for any losses resulting from action taken based on the contents of its charts, commentaries, or price data. Securities and commodities markets involve inherent risk and not all positions are suitable for each individual. Check with your licensed financial advisor or broker prior to taking any action.
Dominick Archive |
© 2005-2022 http://www.MarketOracle.co.uk - The Market Oracle is a FREE Daily Financial Markets Analysis & Forecasting online publication.