


GLX, GLDX, Baby Gold Bull Market Stillborn?
Commodities / Gold and Silver Stocks 2016 Mar 24, 2016 - 12:42 PM GMT

 Today felt like a short covering rally during the bear market years in the PM complex only in reverse. Days like today can make one think that the rally over the last two months is all she wrote for the new bull market.. Did the baby bull die at birth ? Maybe , but I’ll need to see more proof that the bear market for the precious metals stocks, that ended on January 19th of this year is back.
During a bull market it’s nice to see new highs being made even if it’s for the short to intermediate term time frame. Then to confirm a new uptrend we need to see higher highs and higher lows being made. Since the January 19th low we’ve seen the PM stock indexes making higher highs but we’ve not seen a higher low put in yet because the rally has been so strong. Tonight I would like to show you the new bull market for the GLDX, global explores, using horizontal support and resistance lines. You can apply the same principal to the other precious metals stock indexes like the HUI or the GDX.
During the bear market years it was very rare to see a higher high made on any of the precious metals stock indexes. I believe during the 4 1/2 year bear market there were just a couple occasions when we saw a slightly higher high made before the bears took over and moved the price action lower. That hasn’t been the case since the January 19th low.
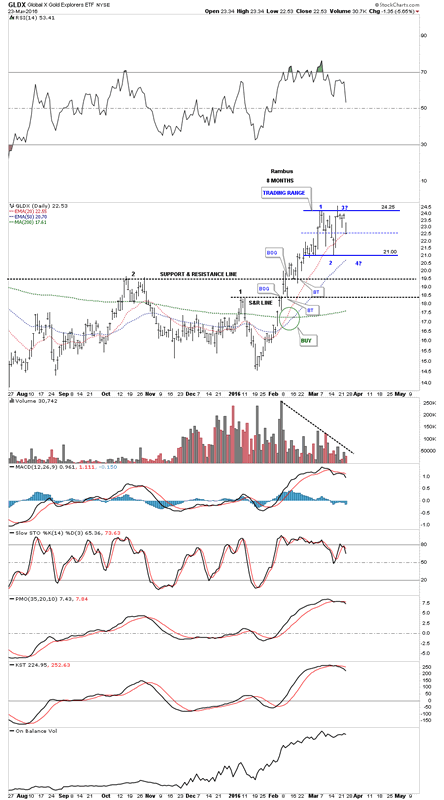
Lets start by looking at a daily eight month chart for the GLDX and then work our way back in time to see how the bear market unfolded and how the potential new bull market may unfold over time using just the horizontal support and resistance lines. On this daily chart you can see the two month rally off of the January 19th low that only had a one or two day decline before the bulls took over and rallied the GLDX higher. Finally during the end of February of this year the GLDX has begun to consolidate that first rally phase chopping out a sideways trading range that is still in progress. Note the bullish crossovers of the 20 day ema, 50 day ema that have crossed above the 200 day simple moving average. Now note the two previous highs labeled #1 and #2 which the GLDX took out with no problem at all. Note how the GLDX gapped above both S&R lines and then backtested them from above before the price action moved higher. It’s subtle but it shows resistance reversing its role and turning into support. There is no doubt that this index is overbought but that’s why consolidation patterns form, to relieve the overbought condition. This eight week rally has taken out two previous highs which is bullish.
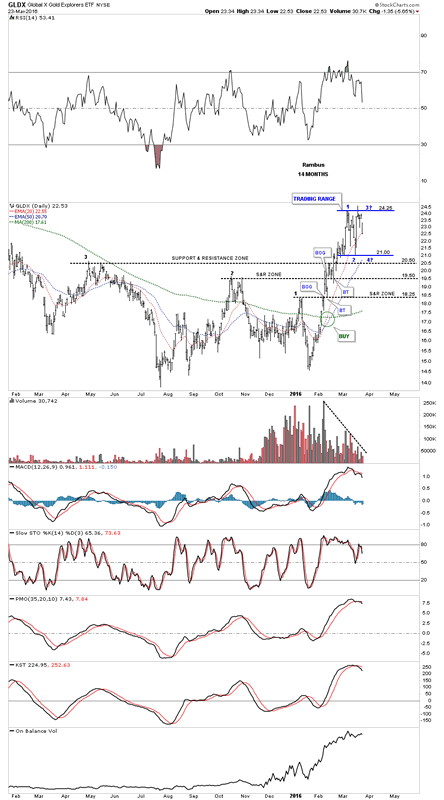
Looking at the 14 month daily chart for the GLDX it shows the price action taking out a third high that was made during the bear market. It could barely make a higher high during the bear market years, but now in less than two months it has taken out three previous highs without any hesitation whatsoever. This is a change in character that hasn’t been seen in over four and a half years which needs to be recognized at a minimum. The new trading range that is forming between 21.00 and 24.50 is healthy and should be expected. Nothing goes straight up without correcting from time to time.
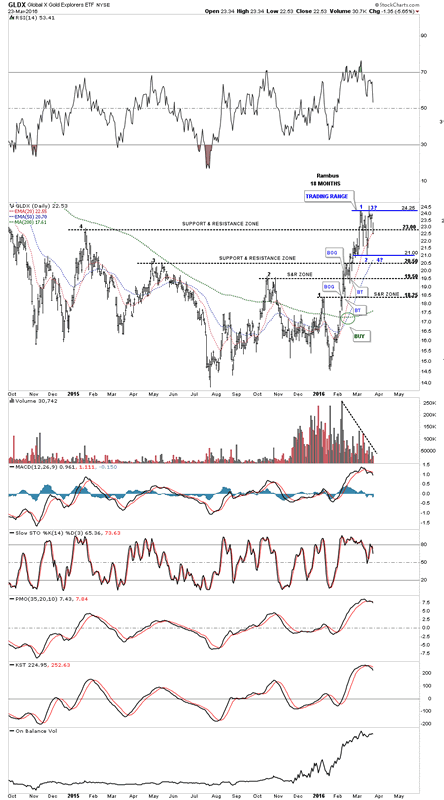
This next chart goes back 18 months and shows a fourth high was taken out with this first impulse move up in the GLDX. After breaking above the fourth high by a little over a point, exhaustion finally set in and the current consolidation phase is taking shape.
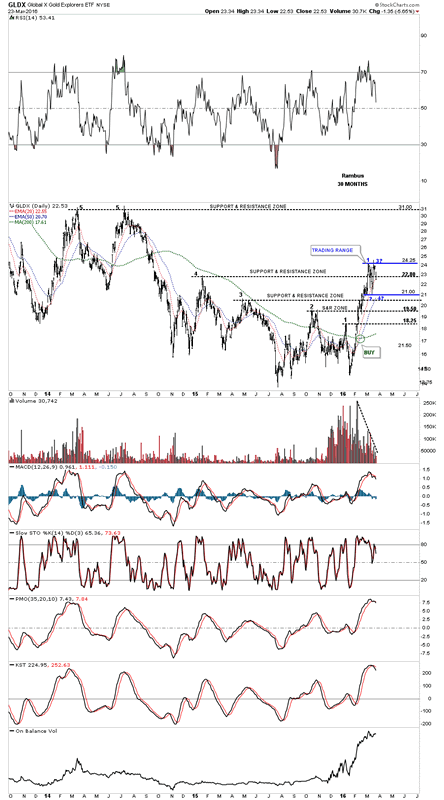
This next chart shows 30 months of price action which is now starting to put our first impulse move up in perspective. The middle of our current trading range is forming on the fourth support and resistance line. Once our current trading range finishes building out a move up to the fifth high should be in order. If we’re truly in a bull market the GLDX will have to make higher highs and higher lows along the way.
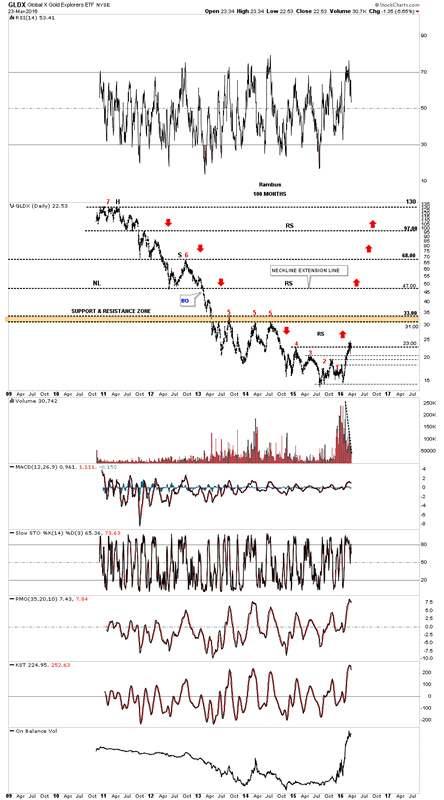
This last chart for the GLDX shows the entire bear market starting at the head in 2011 all the way down to the recent low in January of this year. The brown shaded support and resistance zone, red fives, is where I think we may see a lengthy consolidation pattern build out which will be much bigger than our current one. Once our current trading range ends it should be a fairly easy run up to the brown shaded S&R zone between 31.00 and 33.00 as there were no consolidation patterns that formed on the way down.Some call that area a thin zone I call it reverse symmetry as shown by the red arrows. Once the GLDX breaks above the brown shaded support and resistance zone with the red fives on it, the next price objective would be the old neckline at 47 that formed its massive H&S top which this chart only shows the head, right shoulder and neckline.
Below is a weekly chart for the HUI which shows a similar setup we just looked at in detail on the charts above. When I first labeled the bear market low as a double bottom I used the red arrows to show how the HUI might move up to the next S&R line at 185 or so. Well here we are with a consolidation pattern under construction. This is actually what we want to see happen at the beginning of a new bull market. If the HUI crashes through the previous high at 140 that is where I will have to reconsider the new bull market thesis until then I’m in the bull camp. All the best…Rambus
hui weekly
All the best
Gary (for Rambus Chartology)
© 2016 Copyright Rambus- All Rights Reserved
Disclaimer: The above is a matter of opinion provided for general information purposes only and is not intended as investment advice. Information and analysis above are derived from sources and utilising methods believed to be reliable, but we cannot accept responsibility for any losses you may incur as a result of this analysis. Individuals should consult with their personal financial advisors.
© 2005-2022 http://www.MarketOracle.co.uk - The Market Oracle is a FREE Daily Financial Markets Analysis & Forecasting online publication.