


Lumber Commodity Price Limbers Up
Commodities / Gold and Silver 2016 Apr 08, 2016 - 10:53 AM GMTBy: Austin_Galt

 The lumber price has traded pretty much exactly as outlined in analysis, titled Lumber Lambasted and Lumber Looking Lousy, produced in May 2015 and September 2015 respectively.
I expect price to continue to trade as outlined in those analyses but it doesn't hurt to update the picture so let's do just that beginning with the monthly chart.
Lumber Monthly Chart
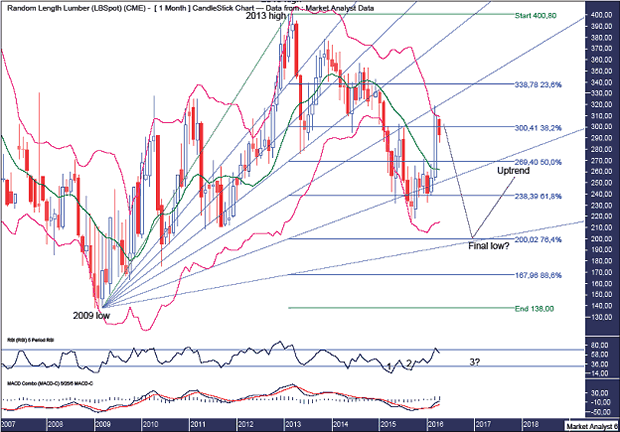
The Bollinger Bands show price has bounced right back up to the upper band and I expect resistance to come in here and send price right back down.
The Fibonacci Fan drawn from the 2009 low to 2013 high shows price is back up at resistance from the 61.8% angle. I favour price to fall from here with the expectation of the final low being down around support from the 88.6% angle.
I have added Fibonacci retracement levels of the move up from the 2009 low to 2013 high and, as laid out previously, I am looking for the final low to get down to at least the 76.4% level which stands at $200.
The RSI shows a bullish divergence in place while a new price low would likely set up a triple bullish divergence.
The MACD indicator is bullish but the averages have diverged a bit and a move back down would rectify that.
Lumber Weekly Chart

As outlined previously, we are following a 5 point broadening low and I believe the point 4 high to now be in place at the $319 quote. Now for the final move down to put in a point 5 low.
The Bollinger Bands show price has left the upper band although I think price will have one last lash at it before the downtrend really gets going.
The Fibonacci Fan drawn from the August 2014 high to point 1 low shows some very nice symmetry with price. The point 2 high was at resistance from the 61.8% angle, the point 3 low was at support from the 23.6% angle while this current point 4 high was just below the 88.6% angle.
The RSI was oversold and now looks headed back down while the MACD indicator looks to be turning back down.
Let's finish up the analysis by looking in close with the daily chart.
Lumber Daily Chart
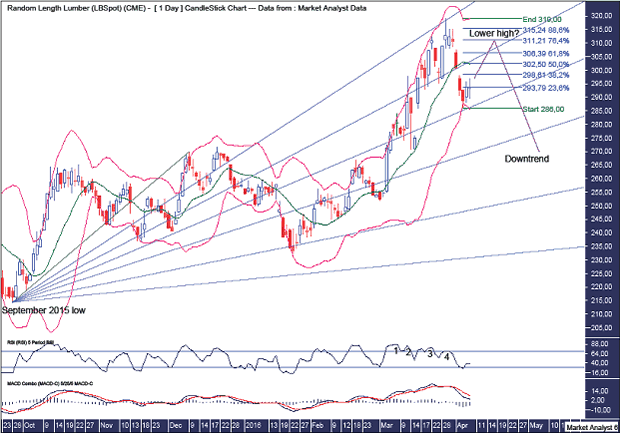
The Bollinger Bands show price trading down to the lower band which looks to be providing some support. There is often some toing and froing between the bands during trend changes and I now favour price to head back to near the upper band and put in a lower high.
The Fibonacci Fan shows the recent high at resistance from the 23.6% angle while price looks to have found support at the 50% angle. I now favour a move back up to test the resistance from the 38.2% angle and it is around that angle that I favour a lower high to form.
I have added Fibonacci retracement levels of the move down from the high. The first rally in a new bear trend often makes a deep retracement and I favour price to rally back to at least the 76.4% level which stands at $311.
The recent high showed a quadruple bearish divergence on the RSI so that is a good sign for the bears.
The MACD indicator is bearish.
Summing up, price has traded as outlined in previous analysis and everything appears set for the downtrend to continue.
By Austin Galt
Austin Galt is The Voodoo Analyst. I have studied charts for over 20 years and am currently a private trader. Several years ago I worked as a licensed advisor with a well known Australian stock broker. While there was an abundance of fundamental analysts, there seemed to be a dearth of technical analysts. My aim here is to provide my view of technical analysis that is both intriguing and misunderstood by many. I like to refer to it as the black magic of stock market analysis.
Email - info@thevoodooanalyst.com
© 2016 Copyright The Voodoo Analyst - All Rights Reserved
Disclaimer: The above is a matter of opinion provided for general information purposes only and is not intended as investment advice. Information and analysis above are derived from sources and utilising methods believed to be reliable, but we cannot accept responsibility for any losses you may incur as a result of this analysis. Individuals should consult with their personal financial advisors.
Austin Galt Archive |
© 2005-2022 http://www.MarketOracle.co.uk - The Market Oracle is a FREE Daily Financial Markets Analysis & Forecasting online publication.