


Apple (AAPL) Stock Price Set To Fall
Companies / Apple Apr 10, 2016 - 12:52 PM GMTBy: Austin_Galt

 Apple Inc (AAPL) is involved in the design, manufacture and marketing of mobile communication and media devices, personal computers and portable digital music players. It is listed on the NASDAQ with a market capitalisation of around $600 billion. Price last traded at $108.66.
Let's take a top down approach beginning with the quarterly chart.
AAPL Quarterly Chart
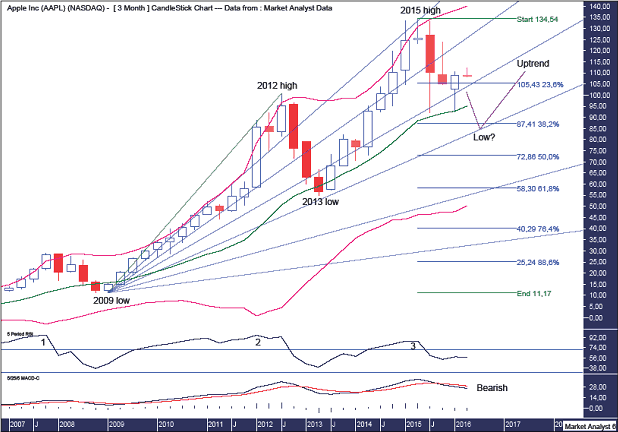
We can see an outstanding bull market in play with the recent move down looking like a correction only within the greater scheme of things. I believe this correction is still playing out with the final low still ahead of us. Why? The following analysis should help explain that.
The Bollinger Bands show the recent low was bang on support from the middle band. While that may be the final low, I favour price doing some more work around this middle band to really test its support. This would see price dip marginally below the band before the buyers pile back in.
The RSI showed a triple bearish divergence at the all time high set in 2015. This often leads to a significant decline and that has already been the case with price dropping just over 30% from the top. However, considering this is the big picture quarterly chart I favour some more damage to the stock price can still be done.
The MACD indicator is bearish with the averages still trending down and buying the top of the rally with this indicator in the current position is not for the faint hearted.
I have drawn a Fibonacci Fan from the 2009 low to 2012 high which has shown some nice symmetry with price. The 2013 low was just above support from the 61.8% angle while the 2015 high was right at resistance from the 23.6% angle. Price has recent found support at the 50% angle however I favour price breaking to new lows and the 61.8% angle is my target to provide solid support for price once again.
I have added Fibonacci retracement levels of the move up from 2009 low to 2015 high and I am looking for the final low to be around support from the 38.2% level which stands at $87.41. Price turning back up here would still keep the overall bull trend in a very solid position.
AAPL Monthly Chart
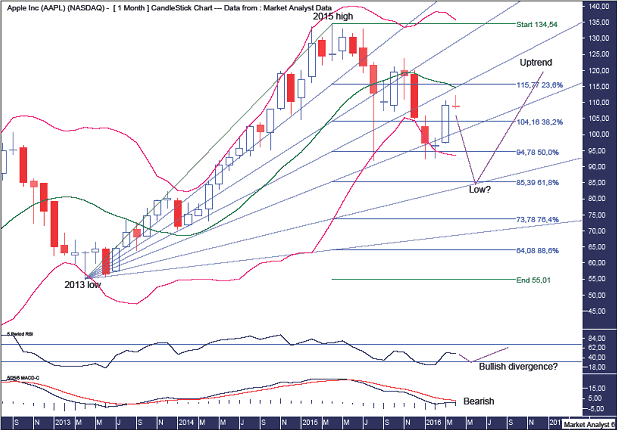
The RSI has bounced back up out of oversold territory although a new low reading was made and the end of corrections are often accompanied by at least one bullish divergence which would require a new price now while the RSI makes a higher low. This is what I favour to take place here.
The MACD indicator is bearish although the averages appear to be coming back together which might indicate the downtrend is nearing its completion.
The Bollinger Bands show price bouncing up off the lower band however price has still not been able to recapture the middle band so I favour price to head back down and push into the lower band before the final low is set.
The Fibonacci Fan drawn from the 2013 low to 2015 high shows the 61.8% angle providing support recently however it is my opinion that the final low will be down around support from the 76.4% angle.
I have added Fibonacci retracement levels of the move up from 2013 low to 2015 high and the recent low clipped the 50% level while I favour an even deeper correction that gets down to the 61.8% level which stands at $85.39.
Why don't I favour the final low to already be in place considering it was at support from both Fibonacci retracement levels and fan angles?
Let's go to the weekly chart to answer that question.
AAPL Weekly Chart
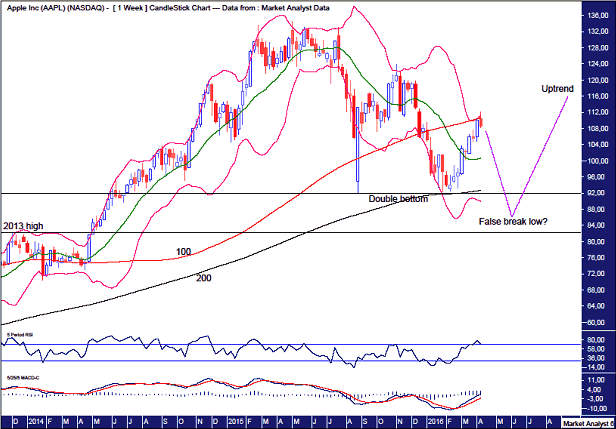
The upper horizontal line denotes a double bottom formed by the August 2015 and January 2016 lows. This is a bearish double bottom against the trend. The majority of double bottoms don't end downtrends. Some do of course and it is these double bottoms that the crowd focuses on and leads them into making the mistake of continually calling the final low as soon as they spot a double bottom.
I expect price to bust this double bottom before turning back up and setting up a false break low in the process. Unlike the double bottom, the false break low is a very common bottoming formation.
The lower horizontal line denotes the 2013 high at $82.16 and I favour the low to form above this support level.
The Bollinger Bands show price appears to be finding resistance back up at the upper band and I expect price to now head back down to the lower band.
I have added moving averages with time periods of 100 (red) and 200 (black) and these are in bullish formation with the red line above the black line. However, price currently looks to be finding resistance at the red line and I favour price to head back down to test the support from the black line and dip marginally below as it gives the support a thorough test.
The RSI is in overbought territory while the MACD indicator is still bullish although the averages have diverged slightly. Price moving down from here would rectify both conditions.
Summing up, I favour price making one last whoosh to the downside to set up the final low. After that, the good times can start rolling again.
Disclosure: I have no financial interest in AAPL.
By Austin Galt
Austin Galt is The Voodoo Analyst. I have studied charts for over 20 years and am currently a private trader. Several years ago I worked as a licensed advisor with a well known Australian stock broker. While there was an abundance of fundamental analysts, there seemed to be a dearth of technical analysts. My aim here is to provide my view of technical analysis that is both intriguing and misunderstood by many. I like to refer to it as the black magic of stock market analysis.
Email - info@thevoodooanalyst.com
© 2016 Copyright The Voodoo Analyst - All Rights Reserved
Disclaimer: The above is a matter of opinion provided for general information purposes only and is not intended as investment advice. Information and analysis above are derived from sources and utilising methods believed to be reliable, but we cannot accept responsibility for any losses you may incur as a result of this analysis. Individuals should consult with their personal financial advisors.
Austin Galt Archive |
© 2005-2022 http://www.MarketOracle.co.uk - The Market Oracle is a FREE Daily Financial Markets Analysis & Forecasting online publication.