


Stock Market Technical Analysis
Stock-Markets / Stock Markets 2016 May 03, 2016 - 05:43 PM GMT

 Technical Summary:
Short Term Trend: Neutral With A Bearish Configuration Possibly Developing.
Medium Term Trend: Bullish.
Long Term Trend: Neutral:Both The 100 DMA and the 200 DMA Are Flat.
Slow Stochastics: Overbought: Market Risk Is High.
Fast Stochastics: Neutral But Trending To Oversold.
VIX: Very Low: Market Risk Is High.
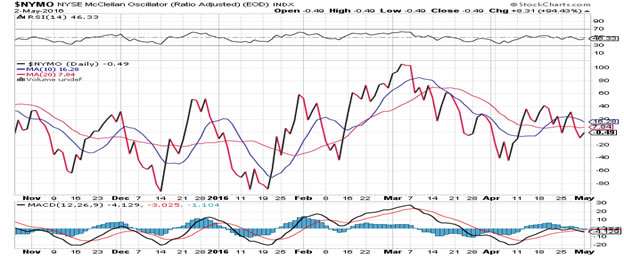
McClennan Oscillator: Low But Trending Down. Not Ideal For Shorting The Market.
A/D Line: Bullish.
Technically Speaking:
The current rally, which broke out on the 22nd. February, is beginning to show signs of exhaustion. Of the major indices the NASDAQ is the weakest. Price has already broken below the 200 Daily Moving Average (DMA) and a break below the 50 DMA could indicate that a short term contraction is probably on the cards.
The VIX is very low and indicates that there is a very high degree of risk in the market, so I would not be chasing price action at the moment. I would wait for a break above the 18.58 level as this would show that the Volatility Index is moving outside its most recent trading range and thus indicate that professional players are beginning to price in future market weakness.
Technically to actively take advantage of developing price weakness I would like the NYSE McClennan Oscillator to be higher but you can’t get every index to be in your favor.
Chart: Dow Jones Industrial Average: Daily.
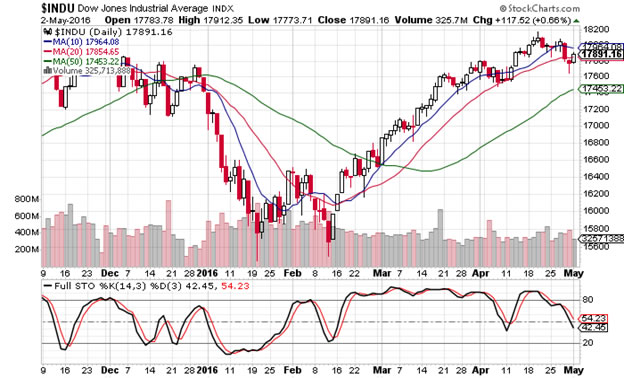
Chart: Dow Jones Transport Average: Daily.
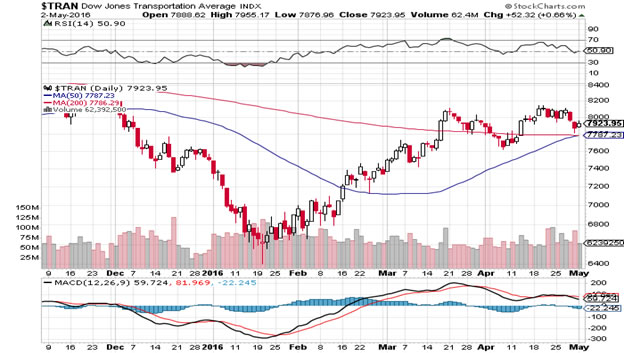
Chart: S & P 500: Daily.
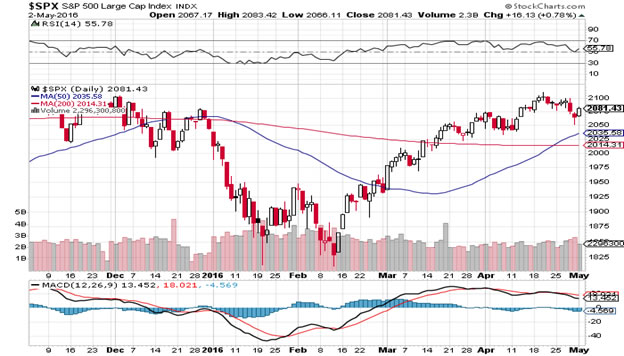
Chart: NASDAQ: Daily.
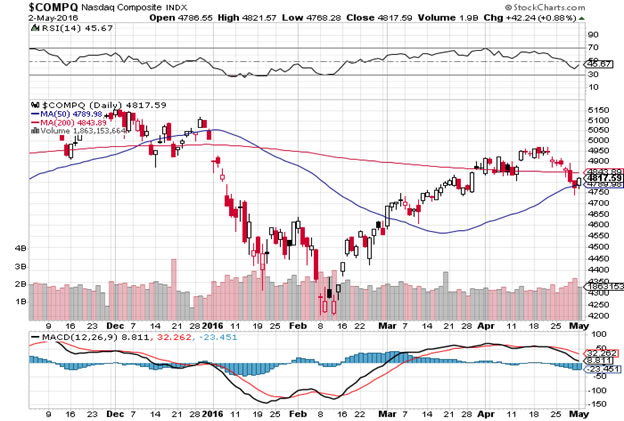
Chart: VIX: Daily.
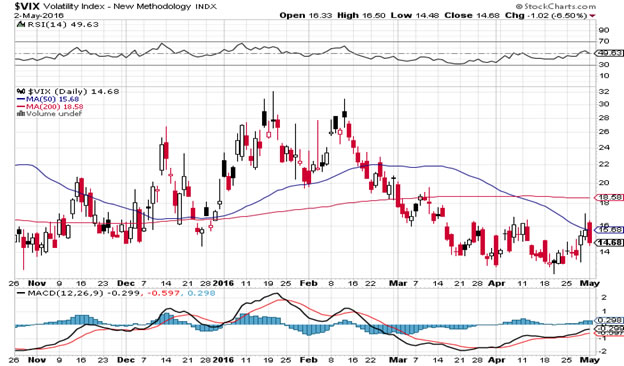
Chart: NYSE McClennan Oscillator: Daily.
In The News:
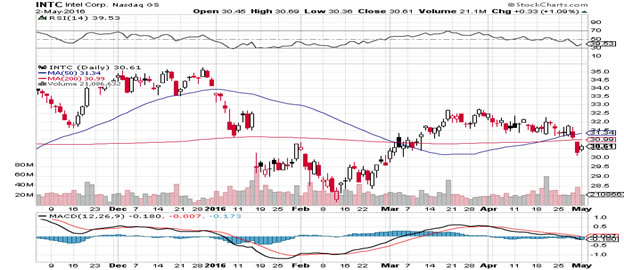
Intel slashes Irish jobs.
One of the greatest success stories of inward investment to Ireland has been the Intel Plant in County Kildare, located just outside the Dublin capital. Currently over 5,000 people are employed there. However, the recent announcement that Intel management was set to shave off 12,000 jobs worldwide has come as a shock to Intel staff, the Irish government and its jobs development arm: The IDA (The Industrial Development Authority).
Given that only two years ago Intel invested over 4 billion dollars in a new production facility at Kildare it is not
expected that too many position losses will be announced to Irish staff. However, people are now beginning to question whether top Intel management are really on top of their game. Is Intel having its “Marketing Myopia” moment? This phenomenon, first noted by famed Harvard Business Professor Theodore Levitt, describes how business leadership fails to notice fundamental shifts in market reality. Such failure usually leads to “top brass” losing control of their entire business model. Think Blackberry’s inability to fully understand the implications of the iPhone or Blockbuster’s denial of the media delivery paradigm shift that was NetFlix.
I hope for the sake of many of my countrymen and women who work in Kildare, that this myopia has not taken root in the Intel boardroom . I pray that they have a strategy to counter the new market force of mobile connectivity. If they have not, I fear the worst.
Chart: Intel Corp: Daily.
Charts Courtesy of StockCharts.com
Christopher Quiqley
B.Sc., M.M.I.I. Grad., M.A.
http://www.wealthbuilder.ie
Mr. Quigley was born in 1958 in Dublin, Ireland. He holds a Bachelor Degree in Accounting and Management from Trinity College Dublin and is a graduate of the Marketing Institute of Ireland. He commenced investing in the stock market in 1989 in Belmont, California where he lived for 6 years. He has developed the Wealthbuilder investment and trading course over the last two decades as a result of research, study and experience. This system marries fundamental analysis with technical analysis and focuses on momentum, value and pension strategies.
Since 2007 Mr. Quigley has written over 80 articles which have been published on popular web sites based in California, New York, London and Dublin.
Mr. Quigley is now lives in Dublin, Ireland and Tampa Bay, Florida.
© 2016 Copyright Christopher M. Quigley - All Rights Reserved
Disclaimer: The above is a matter of opinion provided for general information purposes only and is not intended as investment advice. Information and analysis above are derived from sources and utilising methods believed to be reliable, but we cannot accept responsibility for any trading losses you may incur as a result of this analysis. Individuals should consult with their personal financial advisors before engaging in any trading activities.
Christopher M. Quigley Archive |
© 2005-2022 http://www.MarketOracle.co.uk - The Market Oracle is a FREE Daily Financial Markets Analysis & Forecasting online publication.