


Gold Bull-Phase I Continues to Confound (The Trek to “Known Values”)
Commodities / Gold and Silver 2016 May 22, 2016 - 04:15 PM GMTBy: Plunger

 Since January 20th the precious metal stocks have been in an upward impulse. I have classified this impulse as phase I of a new bull market. My essay “The three phases of a bull market” located on this site explains this in further detail.
http://www.talkmarkets.com/content/goldprecious-metals/the-three-phases-of-a-bull-market?post=92292
In short, phase I is the move off bear market lows to “known Values”. Just prior to this move stocks were left on the bargain table and farsighted, wise investors picked them up from discouraged and distressed sellers. I have described this impulse move toward known values as analogous to a beach ball held under water then released.
With the exception of Rambus, Spock and myself virtually all Precious Metals newsletter writers have advised their subscribers and flocks to take profits and head for the sidelines. No move like this can continue without a major and violent “correction” is what they have advised. They caution we are past due for a severe pullback, staying positioned in these stretched issues is nothing short of reckless.
I have observed otherwise however, and have sat tight in my positions judging that “known values” are still somewhat above us. That exalted level is now starting to come into clearer view as is shown in the following charts:
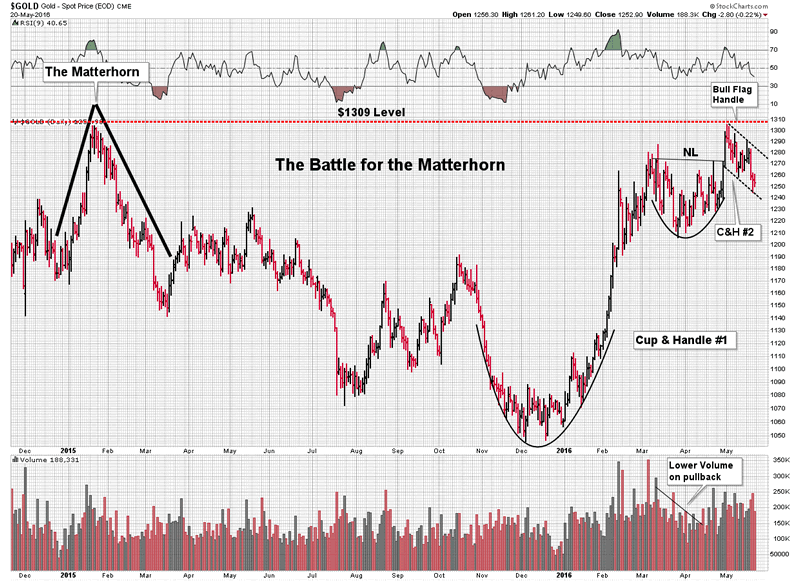
The Battle for the Matterhorn.
This is the current battle between the gold bulls vs bears. It is an outstanding portrayal of the visual picture of accumulation of stronger hands over weaker ones. Saucer shaped bowls are text book patterns of accumulation and we see two prominent depictions here. We also see a rare double stack of two Cup & Handle formations. The higher is a fractal of the first and its handle takes the form of a classic bull flag. Last weeks shake-out action only served to fill out the handle, a case of weaker hands surrendering to stronger hands. This is a bullish picture and appears to be positioning to make a run at the Matterhorn. If it can bust that level the implications of that move are impressive.
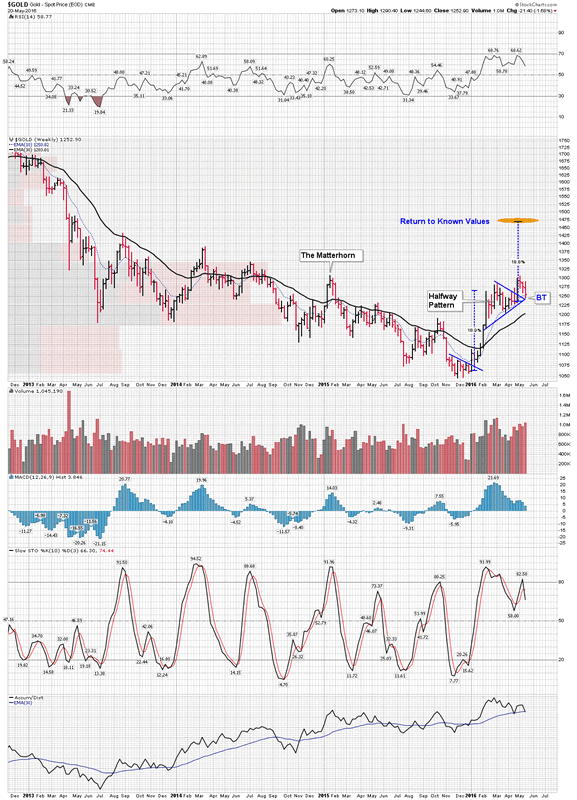
The Bottom :
Taking a step back and looking at a 4 year weekly view lends perspective. In late 2015 we have a final bottom in the bear market taking the form of an inverted H&S bottom. Gold then rocketed up in an impulse move of 19% before consolidating. This consolidation took the form of a pennant which may possibly be a half-way pattern. If so an impulse to impulse measured move would project gold to about the $1475 level. Last weeks action appears to have been a shake out back test of the pennant.
Determining “Known Values”
Implications for the gold stocks:
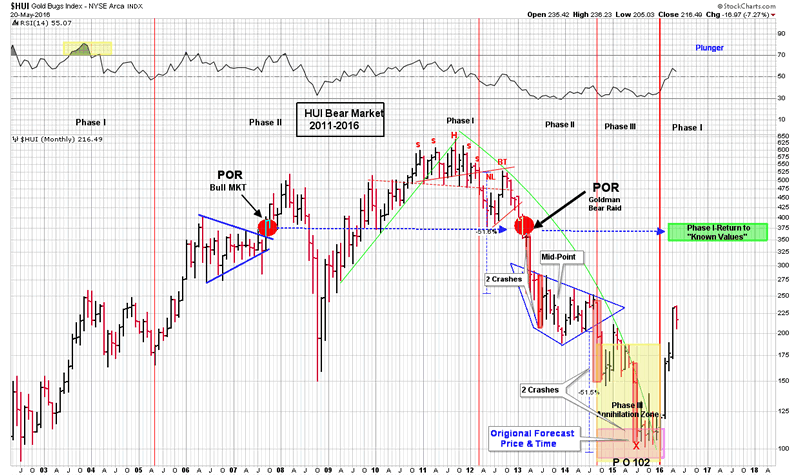
Here is a review of the HUI over the past 13 years. I have shown this before as it depicts the round trip made by the bull and bear. Old news….however here is something new which lends some insight to determining our “known values” price objective. Both bull and bear markets undergo a point of recognition (POR) This is a psychological phenomenon where an inflection point occurs. It is where a critical mass of market participants collectively realize they are now in either a bull or bear market. Up until this moment it is not clear in their minds. It makes sense that this moment corresponds with a rapid price movement. In a bull market investors rush in and in a bear we normally see a crash. This point comes surprisingly well into either the bull or bear. Up until this moment the masses simply don’t “get it” for various reasons.
The POR in the 2000-2011 bull market came in September 2007. Hard to believe it took over 6 years for this moment to gel in peoples minds, but it did. It was a clear division of psychology in the average investors mind. After this moment the public understood gold was in a bull market. In the 5 year bear market from 2011 to 2016 the POR occurred with the Goldman bear raid of April 2013. Recall days before GS put out its infamous “short gold” recommendation then massive paper sell contracts hit the market in the early thinly traded hours in Asia. PM investors had been getting beaten down for months and this was the final straw. After this event the word bear market came out of the closet and could be spoken in public. It was the POR.
It is fascinating that these two opposite events, both bull and bear, occurred at the same price level in the HUI. Since this price level relates to a psychological phenomenon it speaks significance. So my thesis is that the POR of both the prior bull and bear market is related to the publics acceptance of known values. When price left this level they recognized it as a departure from normalcy. In the bull they rushed to buy stock and in the bear they panicked and sold. The average investor’s psychological framework was attached to this price level. I believe the two PORs give us a clue as to where known values exist. The red dots depict the two PORs and how they relate to our current trek to these known values.
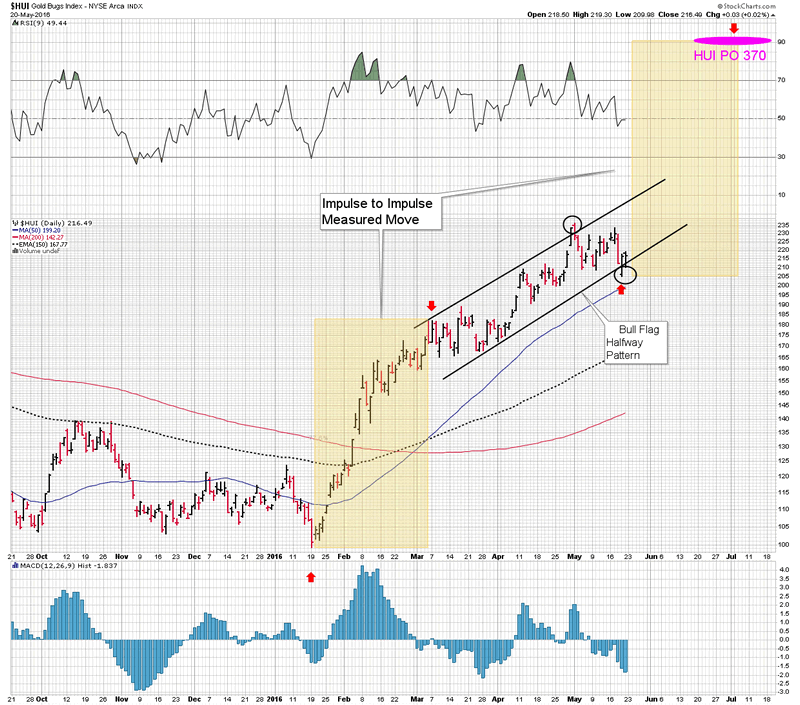
Measured move impulses:
The next chart shows us the impulse off of the January lows. It has been a surge which simply has not looked back. Once it initial impulse was over in early March (red arrow) it entered into a steep bull flag. The steep angle of incidence is consistent with a very bullish event. The bull flag appears to be a half-way pattern with a measured move impulse projecting to a level of HUI 370, which of course is the level of the two PORs. So here we have a technical indication that supports the thesis that known values may be in the area of HUI 370.
The fuel for the second impulse:
As noted the market is now ripe with sold out bulls waiting for lower entry points. These are PM investors who have sold out, on the advice of their mentors, because a correction is imminent. Some have even entered short positions. If gold breaks through the Matterhorn level ($1309) it could provide a spark to these investors to reenter the market and require shorts to cover. This would be the fuel to power the final move for Phase 1 to reach Known Values.
By Plunger
Editor’s Note : Plunger is Resident Market Historian with Rambus Chartology
http://plunger.goldtadise.com/
My Pen name "Plunger" is a spoof based on a quote from P.J. O’Rourke, an American political satirist and journalist
“Giving assets to a stock market plunger is like giving beer and car keys to teenage boys "
A plunger is the polar opposite of a prudent investor. "Most prudent investors find that their permanent profits come from a diversified portfolio where they maintain a discipline of letting profits run and cutting losses quickly. A plunger, on the other hand, will make daring emotional speculations, risking a large percentage of capital on a single trade, having total unquestioned certainty on their "trade-of-the-month". Seldom do they build into a position over time adding increasing purchases only after the market validates their market opinion. No, instead they plunge into the trade all at once."
In my Formal Training I achieved a BS in Economics with a focus on econometrics and political economy .
After earning my degree, my academic journey revealed to me that conventional Keynesian theory was wholly insufficient in explaining the financial world we live in. This led me to the Austrian school of economics as founded by Ludwick Von Mises. I was mentored by Harry Browne and have studied the entire works of Mises and Murray Rothbard.
As an investor and trader I have been principally influenced by Dow Theory and the great analysts who developed and evolved it to what it is today. Modern portfolio management falls far short of what the great stock market theorists of the 20th century had to offer. What has been lost is the skill of interpreting the averages through reading the language of the market .
My role as a market historian has evolved from reading the greats on market history. I have observed the great Wall Street analysts of old were far superior to anyone providing analysis today. So we use the method of these analysts, Charles Dow, William P. Hamilton, Robert Rhea and Richard Russell to guide us. I am also a student of the technical analysis discipline know as Chartology ( a modern adaptation , by TA analyst Rambus , of the classical work authored in the 1950s by Edwards and Magee)
To be successful as an investor one must not follow Wall Streets recommendations, but instead develop the skills to independently interpret the market.
I have been fortunate the past 30 years observing, up close, the economies and cultures of the world in the role of being a Captain for a major International airline."
Copyright © 2016 Plunger - All Rights Reserved
All ideas, opinions, and/or forecasts, expressed or implied herein, are for informational purposes only and should not be construed as a recommendation to invest, trade, and/or speculate in the markets. Any investments, trades, and/or speculations made in light of the ideas, opinions, and/or forecasts, expressed or implied herein, are committed at your own risk, financial or otherwise. The information on this site has been prepared without regard to any particular investor’s investment objectives, financial situation, and needs. Accordingly, investors should not act on any information on this site without obtaining specific advice from their financial advisor. Past performance is no guarantee of future results.
© 2005-2022 http://www.MarketOracle.co.uk - The Market Oracle is a FREE Daily Financial Markets Analysis & Forecasting online publication.