


Stock Market Inflection Point During Bifurcation
Stock-Markets / Stock Markets 2016 Jun 18, 2016 - 12:58 PM GMTBy: Tony_Caldaro

 The market started the week at SPX 2096. After hitting SPX 2098 in the first hour of trading on Monday the market dropped to 2064 by Tuesday. A rally followed into Wednesday on the FOMC meeting, and the market hit SPX 2086 minutes after the FOMC statement. Then the market pulled back again, gapped down to open Thursday, and hit SPX 2050 before rallying to 2080 into the close. Friday saw a lower open as the market dropped to SPX 2063, then bounced to close the week at 2071. For the week the SPX/DOW were -1.05%, and the NDX/NAZ were -1.90%. Economic reports for the week were again mostly positive. On the downtick: industrial production, capacity utilization, housing starts and weekly jobless claims rose. On the uptick: the NY/Philly FED, the NAHB, building permits, the Q2 GDP est., export/import prices, retail sales, business inventories, and the CPI/PPI. Next week’s reports will be highlighted by FED chair Yellen’s semiannual economic report to Congress, Durable goods orders and more Housing reports.
LONG TERM: neutral
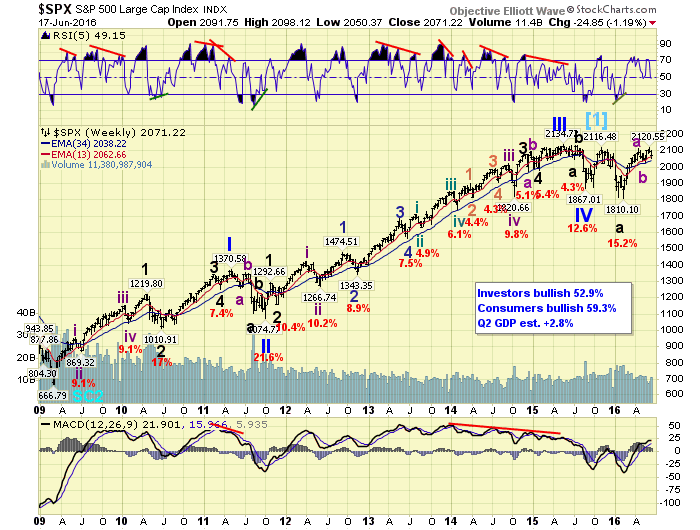
For the past few weeks we have been commenting about an OEW bifurcation between the futures driven SPX and the cash driven NYSE indices. The long term pattern for the SPX suggests the bull market lasted between 2009-2015, ended, and the SPX, plus the three other major indices, are currently in bear market rallies.
The long term pattern in the NYSE suggests the bull market is still ongoing with only Primary III ending in 2015, Primary IV in 2016, and Primary V underway now.
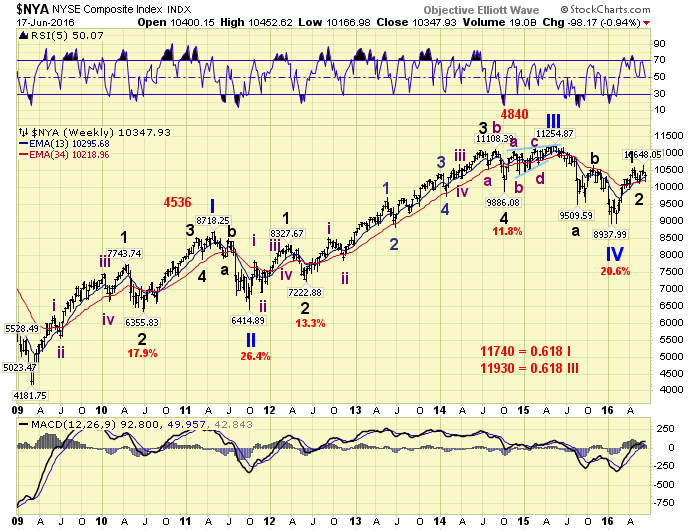
If one of these two distinct patterns is displaying an aberration we would expect it to be the NYSE. After all we have four separate indices all displaying the same pattern, SPX/DOW/NDX/NAZ, and only the NYSE displaying the P5 pattern. Which offers us a third pattern, that we vaguely alluded to last week.
While we have been debating the merits of both of these patterns the market has entered an inflection point. This should make it easier on our analysis as it appears the market will make the decision for us. For the past 2.5 months the market has been trading within a SPX 2026-2121 range. This range was entered after the market had a strong 200 point rally, within 1.5 months, from the SPX 1810 mid-February low. The inflection point is simple. A market breakdown below the SPX 2026 suggests a resumption of the bear market. A market breakout above the SPX 2121 suggests a more bullish outcome longer term. Until this range is pierced one could say we are neutral-neutral longer term.
MEDIUM TERM: uptrend under pressure
The two month uptrend, from mid-February to mid-April, was quite explosive: SPX 1810-2111. Depending upon which metric we use it can be counted as corrective (bearish metric), or impulsive (bullish metric). The short one month 4% correction that followed was clearly corrective, and the market entered another uptrend.
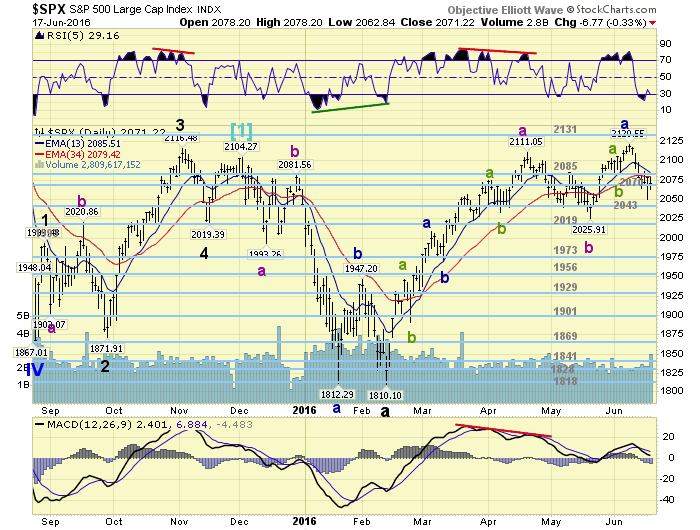
Thus far this uptrend has been quite short, SPX 2026-2121, made a marginal higher high, and has already retraced about 80% of its advance during this past week. Certainly it looks nothing like the previous uptrend. Regardless of either metric noted above, the market has set up an inflection point. Should the market breakdown through the range, these three waves can be counted as an a-b-c up to complete Major wave B of the bear market. Should the market breakout of the range, these three waves can be counted as a 1-2-3 with a more bullish outcome. A ninety-five point range that may be easily swayed by the result of Britain’s Brexit vote this coming Thursday. Should they vote ‘leave’ we could witness a 2011 event. Should they vote ‘stay’, with the US economy improving over the past few months, it certainly can kick off a wave 3. Should be an interesting week. Medium term support is at the 2070 and 2043 pivots, with resistance at the 2085 and 2131 pivots.
SHORT TERM
As noted above, both uptrends can be counted as corrective/impulsive depending upon which metric we use to define the count within the trend. We have been labeling both uptrends as corrective because the overall pattern suggested an ongoing bear market. Medium and long term trends are quantified, so there is only one parameter/metric.
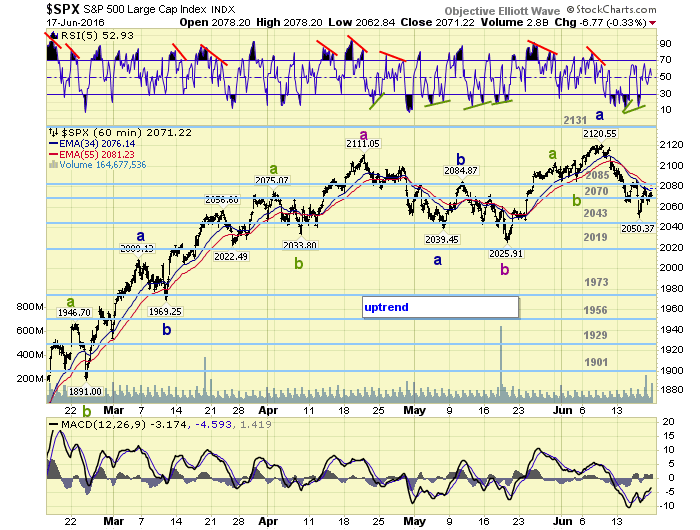
Currently this uptrend has rallied 95 points, SPX 2026-2121, and this week pulled back to SPX 2050, retracing nearly 80% of that advance. This is quite odd for an ongoing uptrend, suggesting possibly a new downtrend is underway. The key levels to watch naturally are SPX 2050 and SPX 2026. The first in the upper range of the 2043 pivot, and the second the upper range of the 2019 pivot. A breakdown of these levels could suggest a retest of the low SPX 1800’s again. Quite a serious decline. Should the market rally above SPX 2086 this steep pullback may be over, and a resumption of the uptrend is then likely. Best to your trading this upcoming week!
FOREIGN MARKETS
Asian markets were mostly lower on the week for a net loss of 2.5%.
European markets were also lower losing 2.4%.
The Commodity equity group were mixed losing 0.8%.
The DJ World index lost 1.7%.
COMMODITIES
Bonds remain in an uptrend and gained 0.2%.
Crude is also in an uptrend but lost 0.7%.
Gold confirmed its uptrend and gained 1.5%.
The USD remains in an uptrend but lost 0.4%.
NEXT WEEK
Tuesday: FED chair Yellen testifies before Congress, and FED governor Powell gives a speech. Wednesday: the FHFA and existing home sales. Thursday: weekly jobless claims, and new home sales. Friday: durable goods and consumer sentiment. Best to your weekend and week!
CHARTS: http://stockcharts.com/public/1269446/tenpp
After about 40 years of investing in the markets one learns that the markets are constantly changing, not only in price, but in what drives the markets. In the 1960s, the Nifty Fifty were the leaders of the stock market. In the 1970s, stock selection using Technical Analysis was important, as the market stayed with a trading range for the entire decade. In the 1980s, the market finally broke out of it doldrums, as the DOW broke through 1100 in 1982, and launched the greatest bull market on record.
Sharing is an important aspect of a life. Over 100 people have joined our group, from all walks of life, covering twenty three countries across the globe. It's been the most fun I have ever had in the market. Sharing uncommon knowledge, with investors. In hope of aiding them in finding their financial independence.
Copyright © 2016 Tony Caldaro - All Rights Reserved Disclaimer: The above is a matter of opinion provided for general information purposes only and is not intended as investment advice. Information and analysis above are derived from sources and utilising methods believed to be reliable, but we cannot accept responsibility for any losses you may incur as a result of this analysis. Individuals should consult with their personal financial advisors.
Tony Caldaro Archive |
© 2005-2022 http://www.MarketOracle.co.uk - The Market Oracle is a FREE Daily Financial Markets Analysis & Forecasting online publication.