


Does BREXIT Matter? Outlook for Sterling
Currencies / British Pound Jun 23, 2016 - 03:02 PM GMTBy: Marc_Horn

 This I want to use as an example of MWA so you can get a feel of how and why.....in my previous article I said BREXIT and your vote is only an illusion.
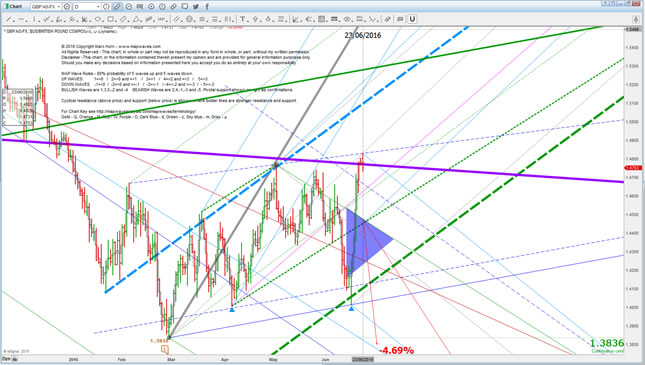
The overview last 3 pivots of same fractal - don't worry you will get to see them - they will become pretty obvious with practice and application of the rules and theory. The green ML is the target for a healthy wave 1 on the next smaller fractal. Failure to reach ML with break of MLL is weakness and the target then becomes SP to the high MLL or WL-1. The break is confirmed with a break of the lowest pivot or highest pivot depending on the trend.
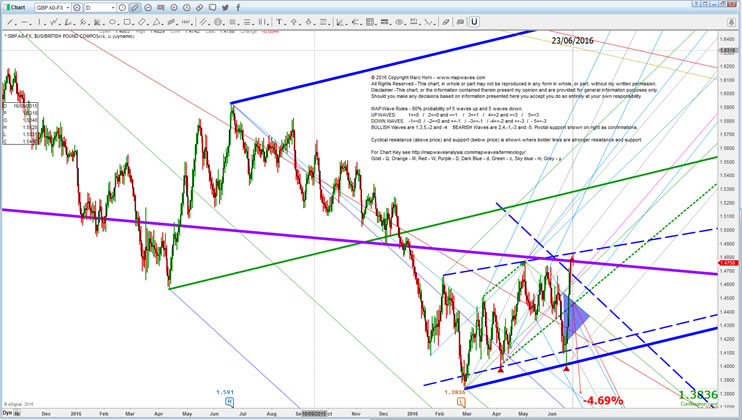
The trend for the next smaller fractal
The ideal wave target for the next smaller fractal pivot 1 is the ML with the next fractal ML, so the intersection of the upsloping dashed ML (blue) and the ML previously shown is the ideal wave target for m1. You can see the affect of old cycle lines - the purple one here - they still have an influence and hence this is a strong cyclical attraction point.
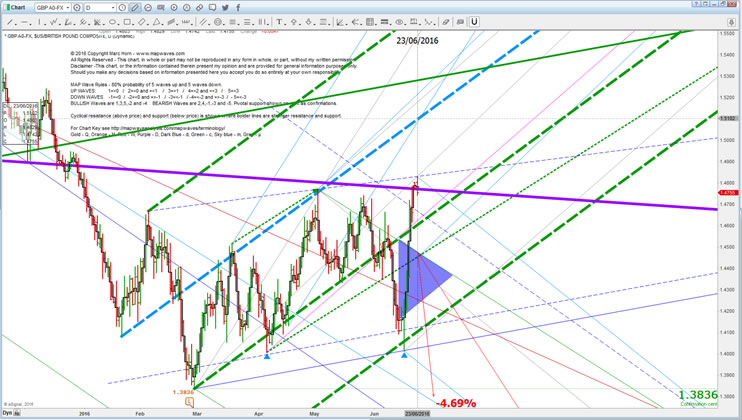
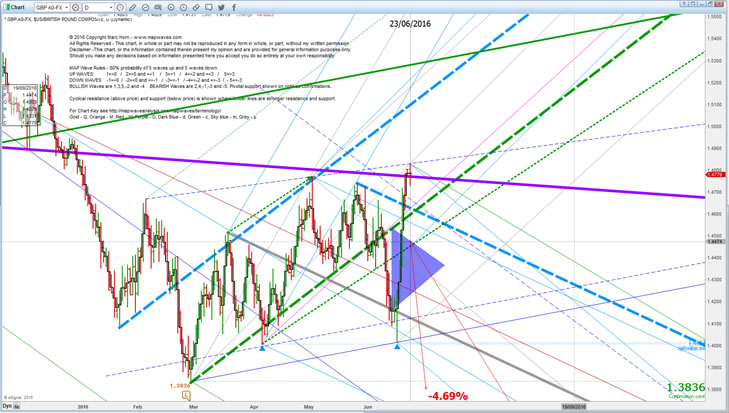
Below we can see prices hitting the ML, prices changed trend, did not make the ML and broke the MLU which is an indication of strength , and moved to the cML a second time. A new low was not made. A break above the first hit confirmed we are still in m1 and a new high was made.
On this high we move the MLL definition point. The new target is the ML with the bigger fractal MLL so we can expect a sharp drop assuming m1 is in. We did not hit the target on the day and a temporary low was made the following day. The mMLU and cMLL is now the target for the low. Prices struggled to get through the MLU and fell back to the cMLL ahead of our next target. Prices had completed a measured amplitude - from the ML to a parallel and hence is a highly likely m2.
So as this is high probability pivot we draw in fork m012, and the target is it's ML with the next larger fractal ML as shown below which is where prices turned.
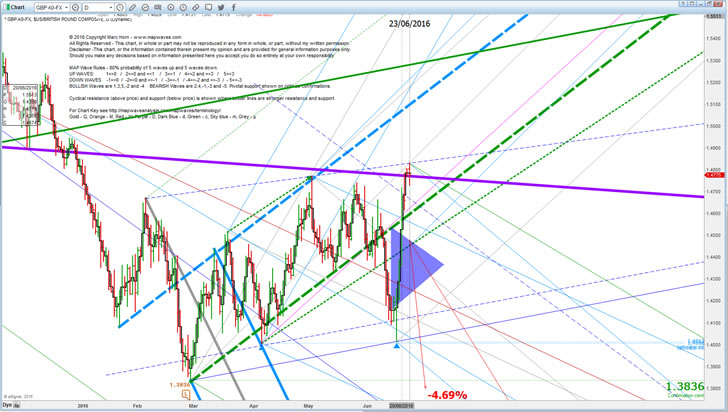
NOISE -Prices fell below mMLL and made a new high above c1, and hence at that point is confirmed as noise on the m fractal.
I have also drawn in WL-1, m2 exceeded WL-1 but turned on the previously shown MLL which is one fractal bigger - hence this is noise on the milli fractal.
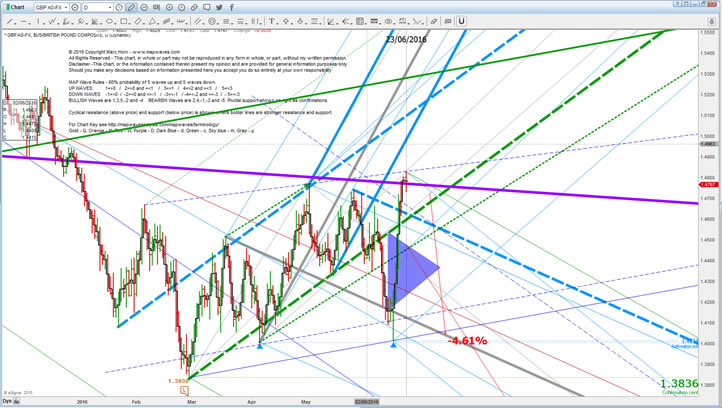
Once m3 is in then we draw fork m123 and this ML intersection with c345MLL is our ideal wave target.
As prices were at our ideal wave target within a day this is an extremely high probability pivot. Add to that the bar or candle has a long wick - this often also indicates pivots. Also note it is at pivotal support! So alot of things here point to a pivot!
Prices hit the c345MLL after ideal time with the intersection of m123ML, so cycle amplitude was reached but not price - this is bullish as often it is a sign of subwave formation.
An exact support line is also put in from m1 to m3 parallel from m2, the small dashed green line. Prices failed to reach this which means ideal wave amplitude has not been reached which is bearish.
Also we draw the m123 ML to m4 SP as that is the amplitude where we can expect a turn.
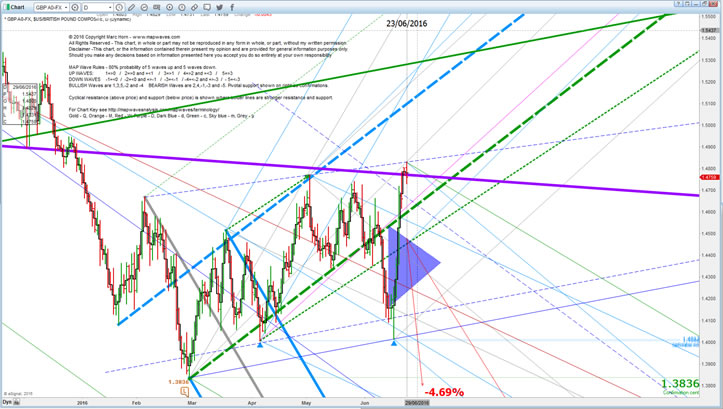
We draw m234 and the ideal wave target is as again ML intersections as shown below. As prices are still no where near the d345ML (bold green) it really needs an extended 5th wave - subwaves...
Most likely µ1 target is the ML intersection with the purple line. Prices failed to reach the ML, but the m234MLL held support initially, and the second time cMLL support held so here is a possible subwave which would provide the energy and it is at an expected amplitude turn - the SP.
From here prices broke the m234MLL, but support of the c345MLL held...... initially and then our target is the cluster which ideally is today at 1.4116, and also falls on the d345MLL SP to m2! This is destructive wave superposition!
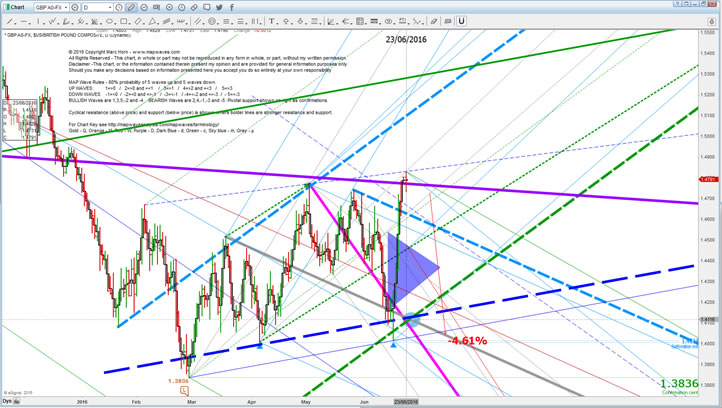
This was hit early and we had a spike low down to the d345 MLL, and yesterday we met the MAP Wave valid pivot m5 with a high above m3!!! THIS IS WHAT MARTIN ARMSTRONG CALLS A CYCLE INVERSION - basically if you cant logically explain it you need a way out. This however is easily explained as demonstrated using systematic cycle measuring rules!
Draw in m234 and the ML is the target which has been exceeded - this potentially is a healthy wave 1..... or your ideal wave 5 capitulation!
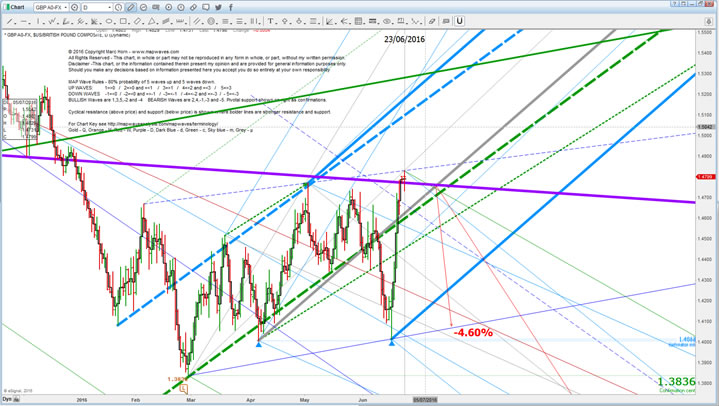
Where to from here?????
You can see the the purple line is resistance and this is only the first hit. Prices DECISIVELY need to break above this - within the next few days and no later than the end of the triangle you can see by the 11th July - so within 2 weeks. They will move upto the intersection of the green ML we started this analysis which with the m234ML gives an ideal wave target of 1.545 in early October!
Zooming out yesterdays high is not just coincidence. It has hit strong resistance for the third time - must break out and retest for bullish scenario.
The darker blue triangle is the initial expected range going into August, and the lighter to the end of December.
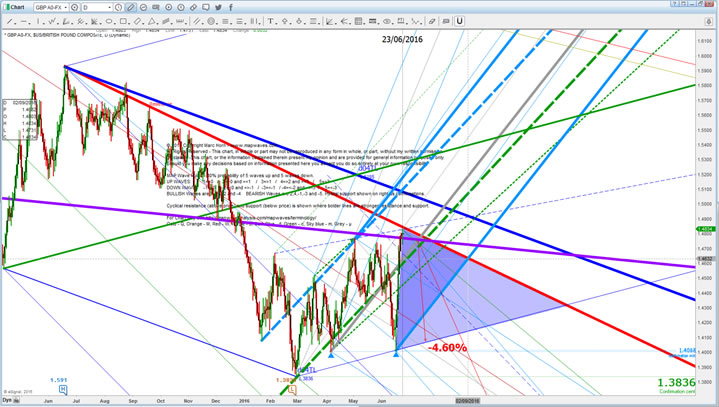
You can see the next resistance level is the ideal cyclical target amplitude. And the healthy wave 1 target is way above that!!!
Within the next 3 months the pounds fate is sealed. MAP Wave analysis says in or out of Europe the pound will be making new all time low next year!
By using MAP Wave Analysis (MWA) you confirm that you are personally responsible for any and every decision you make based on any content found on this site.
- You confirm that you have read and agree to abide by the Copyright and Intellectual Property Rights as stated .
- You confirm that you have read and agree to follow Your Duty of Care as stated
- You confirm that you have read and agree to and take full personal responsibility for your decisions as stated in the Disclaimer.
- You confirm that you have read and agree to and will abide by principles of my Terms of Service as stated.
For other articles published click here
© 2016 Copyright Marc Horn- All Rights Reserved Disclaimer: The above is a matter of opinion provided for general information purposes only and is not intended as investment advice. Information and analysis above are derived from sources and utilising methods believed to be reliable, but we cannot accept responsibility for any losses you may incur as a result of this analysis. Individuals should consult with their personal financial advisors.
© 2005-2022 http://www.MarketOracle.co.uk - The Market Oracle is a FREE Daily Financial Markets Analysis & Forecasting online publication.