Major Debt and Dow Collapse Will Set Ideal Conditions For Silver
Commodities / Gold and Silver 2016 Jun 27, 2016 - 12:22 PM GMTBy: Hubert_Moolman
 The current silver bull market is similar to the bull market of the 70s in many ways. Despite the similarities, silver will ultimately perform much better than during the 70s.
One of the big reasons for this is the fact that debt levels are so much higher today, than during the 70s. Not only are debt levels higher on an absolute basis, but also on a relative basis. For example, Total Us Debt as a Percentage of GDP is about 360% today, whereas, in the 70s it was around 150%.
The reason that higher debt levels will contribute to a more powerful silver bull market is because silver is basically a complete opposite of debt. This is evident in the fact that silver and bonds (debt) have historically moved in opposite directions. If silver is going up, then bonds are going down and vice versa.
With debt levels at all-time highs, there is not much more room to take on more debt (like during the 70s), which can slow down any silver price advancement. Furthermore, with debt levels at all-time highs, credit has more potential to fall or crash (and it will).
However, these higher debt levels will only cause a more powerful silver rally if the debt bubble actually bursts, and does so at the correct time, and in the right manner. Then, not only will silver's advancement not be slowed down, but it will get a major “turbo” boost (more than it got during the 70s). The following fractal analysis shows that this is likely the case.
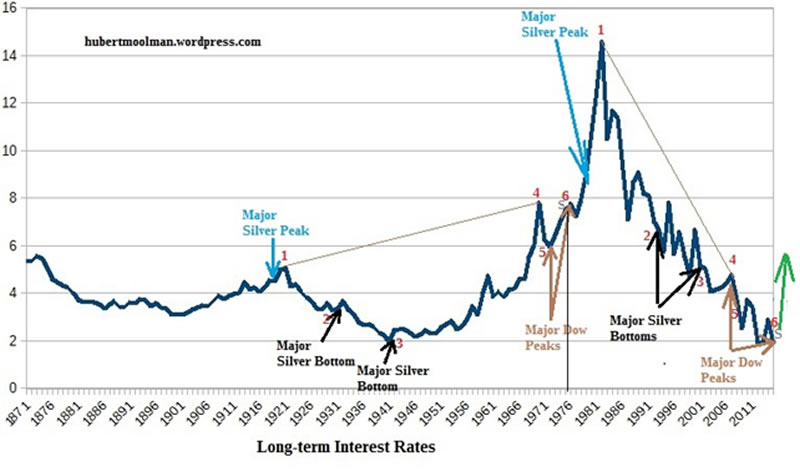
Below, is a long-term interest rate chart (data from R Shiller), to illustrate the above:

Note: it is important to understand that interest rates are an indication of the value the market places on debt (or bonds). If interest rates are low, then the market places a high value on debt, and if the interest rates are high, then a low value is placed on debt.
So, if the debt bubble bursts, it would mean much higher interest rates.
On the chart, I have marked two fractals (1 to 5). Both fractals start at point 1 – the major interest rate peak just after a major silver peak (1919 and 1980 respectively). From point 1 to point 4 on both fractals, a cup-type pattern was formed.
On both cups there were major silver bottoms at point 2 and 3. Points 4 to 6 formed the handle of the cups. During the handle of both patterns, major Dow peaks were formed.
Very close to point 6, on both patterns, a silver bottom was formed (point S). During the 70s, that was the silver bottom (January 1976) just before the final silver blow-off stage (1976 to 1980). The current bottom at point S (December 2016) is the bottom that could lead to the final blow-off stage.
If the comparison is justified, then we should look for a breakout of the current pattern, just like the old pattern did around 1978/1979. A breakout from these cup-type patterns can be quite explosive, just like the old pattern illustrated. A change in the direction of interest rates, as shown on the current pattern will be much more significant than that of the 70s, since it would signify a major trend change.
This is the type of trend change that one should expect to see when the monetary system is collapsing, while silver goes parabolic. This is further solidified by the fact that it will happen at the same time as a major change of trend for the Dow, due to the coming Dow collapse.
For more on this and this kind of fractal analysis, you are welcome to subscribe to my premium service. I have also recently completed a Silver Fractal Analysis Report as well as a Gold Fractal Analysis Report
Warm regards
Hubert
“And it shall come to pass, that whosoever shall call on the name of the Lord shall be saved”
http://hubertmoolman.wordpress.com/
You can email any comments to hubert@hgmandassociates.co.za
© 2016 Copyright Hubert Moolman - All Rights Reserved
Disclaimer: The above is a matter of opinion provided for general information purposes only and is not intended as investment advice. Information and analysis above are derived from sources and utilising methods believed to be reliable, but we cannot accept responsibility for any losses you may incur as a result of this analysis. Individuals should consult with their personal financial advisors.
© 2005-2022 http://www.MarketOracle.co.uk - The Market Oracle is a FREE Daily Financial Markets Analysis & Forecasting online publication.


