Gold, Platinum, and Silver Speak To Us!
Commodities / Gold and Silver 2016 Jul 05, 2016 - 02:58 PM GMTBy: DeviantInvestor
 The prices of gold, platinum and silver are important and communicate valuable insights. Consider the price of monthly gold for 20 years – log scale below.
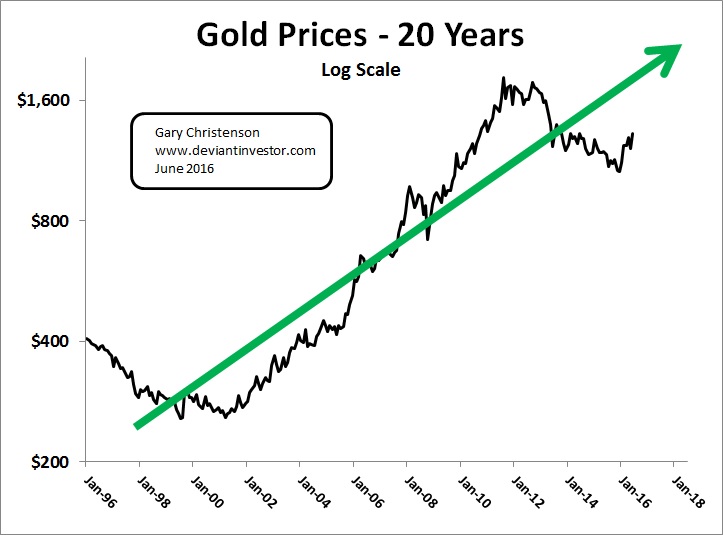
Ignore the daily and weekly gyrations, forget the self-serving pronouncements from Goldman, do not trust the paper-pushers at the Fed, and look at the big trends in the price charts.
- Gold in US$ is rising along with debt, currency in circulation, and economic nonsense pretending to be academic wisdom.
- The value and purchasing power of the dollar (euro, yen, pound etc.) is declining as governments and central bankers encourage us to drown in debt.
- The gold trend since 2001 has been up. Expect that trend to continue until central banks admit failure and resign, politicians actually reduce debt, or an extra-terrestrial inhabits the White House, whichever comes first.
Date Gold Price
Aug. 1971 $42.7 when Pres. Nixon did the deed
Aug. 1991 $353
Aug. 2011 $1,829
June 2016 $1,325
Examine the gold to platinum ratio, based on monthly data, and look at the big trends.
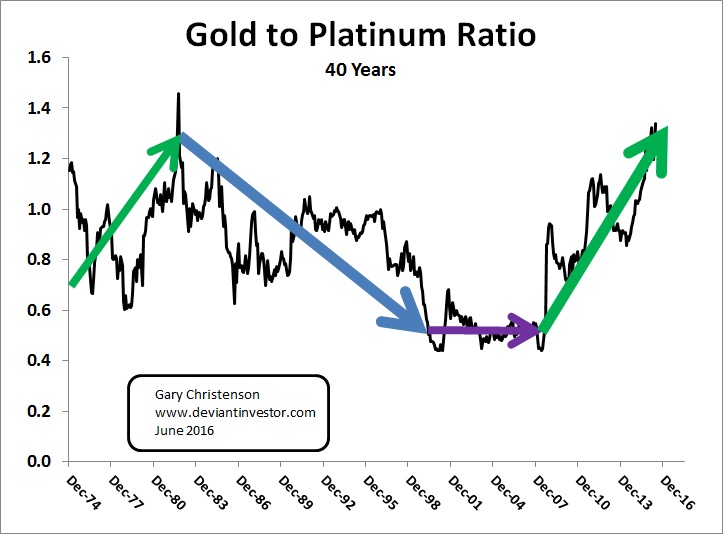
Ratio Up 1975 – 1980: During the inflationary 1970s, fear rose, confidence decreased, investors distrusted bonds and stocks, while commodities and oil prices rose. Gold was stronger than platinum.
Ratio Down 1980 – 2000: The “age of paper” gave the US a massive rally in stock and bond prices while gold, silver and commodities languished. Crude oil dropped under $11.00 in 1998. Gold was weaker than platinum.
Ratio Flat 2000 – 2008: Prices for gold, silver, stocks, oil and more rallied and fell. The financial crisis of 2008 shook everyone.
Ratio Up 2008 – 2016: Stocks and bonds rallied from crash lows, financial fears surfaced again, gold rallied and fell, and platinum and silver fell hard after 2011. But the rally in the gold to platinum ratio shows that gold is increasingly desired as the global paper Ponzi scheme weakens and confidence in governments and central bankers declines.
Examine the silver to platinum ratio, based on monthly data, and look at the big trend.
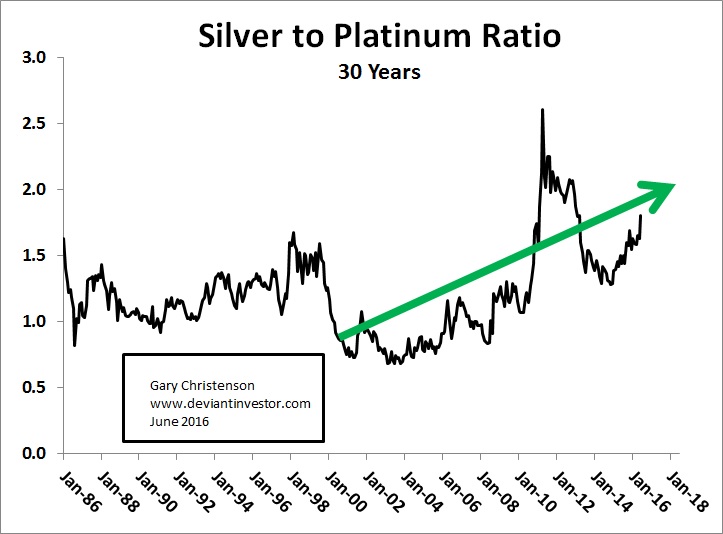
The trend has been up since about 2000. Silver prices have been crushed several times and have recovered. The paper Ponzi scheme slowly drives investors toward physical silver.
Date Silver Price
Aug. 1971 $1.39
Aug. 1991 $3.81
Aug. 2011 $41.00
June 2016 $17.70
Examine the silver to gold ratio, based on monthly data, and look at the big trends.
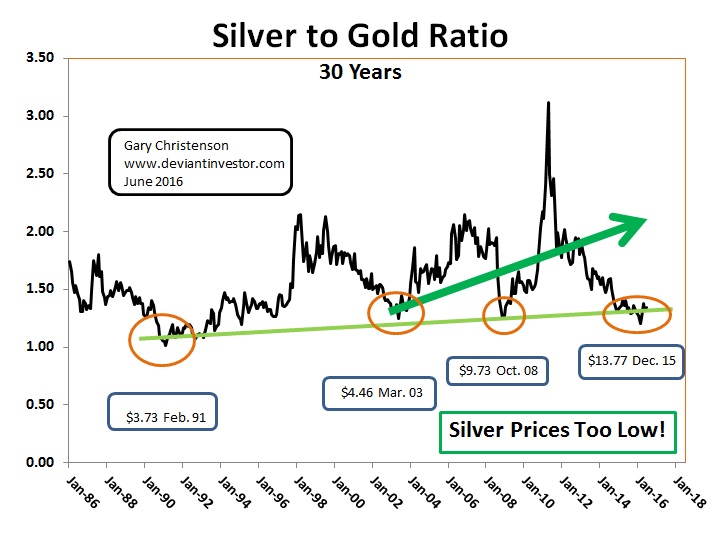
Note the low prices shown for silver in 1991, 2003, 2008 and December 2015 as indicated by coincident lows in the silver to gold ratio. We can see that:
- Silver to gold ratio was at a 25 year low a few months ago.
- The green arrow trend, as I have drawn it, has been strongly up since 2003.
- Silver prices are historically low (compared to gold, debt, total currency etc.) and climbing.
- Continual increases in both debt and currency in circulation will massively increase silver prices during the upcoming years.
CONCLUSIONS:
- The gold to platinum ratio is increasing as the world gradually realizes the paper Ponzi scheme is highly vulnerable. Would you rather hold gold bars or paper bonds yielding “negative interest” issued by an insolvent government that promised to repay you (if at all) in devalued currency units?
- Silver prices are near 25 year lows relative to gold, which indicates silver prices are low and rising. Expect $100 silver soon. How soon? Ask yourself how crazy will governments and central banks become when they are forced (again) to prop up paper prices during a paper asset crash from current bubble-like levels?
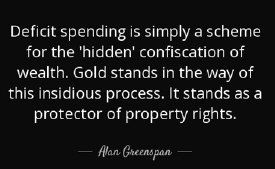
Alan Greenspan on the return to a Gold Standard:
“If we went back on the gold standard and we adhered to the actual structure of the gold standard as it existed prior to 1913, we’d be fine. Remember that the period 1870 to 1913 was one of the most aggressive periods economically that we’ve had in the United States, and that was a golden period of the gold standard. I’m known as a gold bug and everyone laughs at me, but why do central banks own gold now?”
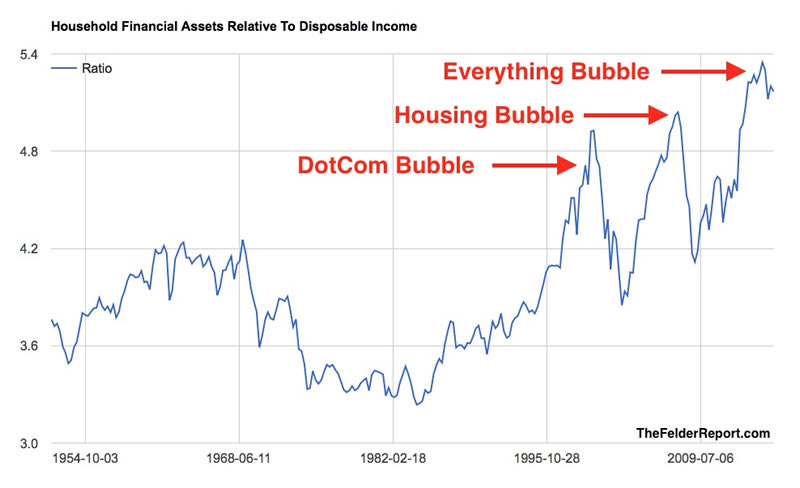
CHOICES?
Bonds or Gold
Stay or Leave
$20 in paper or An Ounce of Silver
EU Eurocrats or Elected Government
Political promises or Facts
Devaluing currencies or Gold
Paper and digital bubbles or Physical gold and silver
The choices should be easy.
Gary Christenson
GE Christenson aka Deviant Investor If you would like to be updated on new blog posts, please subscribe to my RSS Feed or e-mail
© 2016 Copyright Deviant Investor - All Rights Reserved Disclaimer: The above is a matter of opinion provided for general information purposes only and is not intended as investment advice. Information and analysis above are derived from sources and utilising methods believed to be reliable, but we cannot accept responsibility for any losses you may incur as a result of this analysis. Individuals should consult with their personal financial advisors.
Deviant Investor Archive |
© 2005-2022 http://www.MarketOracle.co.uk - The Market Oracle is a FREE Daily Financial Markets Analysis & Forecasting online publication.


