


SPX Stock Market Uptrend Continues
Stock-Markets / Stock Markets 2016 Jul 23, 2016 - 05:41 PM GMTBy: Tony_Caldaro

 The market started the week at SPX 2162. The market had a small bounce on Monday, then pulled back to SPX 2159 on Tuesday. Wednesday the market opened higher and rallied to SPX 2176, a new all time high. Thursday the market pulled back to SPX 2160, then rallied on Friday to end the week at 2175. For the week the SPX/DOW gained 0.45%, and the NDX/NAZ gained 1.55%. Economic reports for the week were positive. On the downtick: the NAHB and the Philly FED. On the uptick: building permits, housing starts, existing home sales, the FHFA, leading indicators and weekly jobless claims improved. Next week’s reports will be highlighted by the FOMC meeting and Q2 GDP.
LONG TERM: uptrend
Since we are dealing with possibilities/probabilities at this juncture in the equity market. We would like to add one more count, other than the Primary 5 and Major B counts already presented. This count suggests that Cycle wave [1] not only did not end at SPX 2135 in May 2015, but will not end for many more years to come. A little background.
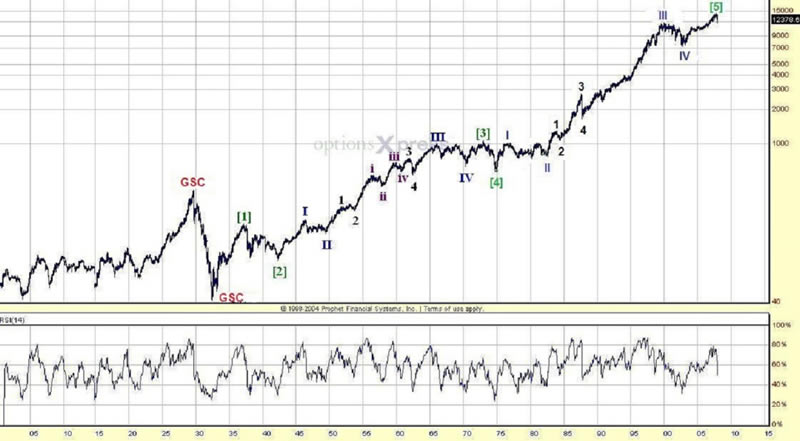
After the Grand Super cycle low in the year 1932, the market entered Super cycle 1 of a new GSC. SC 1 consisted of five Cycle waves (in years): 1937-1942-1973-1974-2007. Notice Cycle 1 was only 5 years, and Cycles 3 and 5 were over 30 years each. After the SC 2 low in March 2009 the market started Cycle wave 1 of SC 3. We naturally expected it to be short, in years, as noted in the last weekend update. After completing five waves up into 2015 the market entered a bear market. But the bear market only corrected 15%, and now the SPX is making new highs again. In the past 115 years this has only occurred four times. And each of these times the market was in an extended Cycle wave, not a short one. Which suggests this Cycle wave [1] is extending.
We also noted last week, the recent 2015/2016 activity has not occurred since 1953. After the 1949-1953 bull market during Cycle 3, the bear market that followed was less damaging, in percentage terms, than a correction within that bull market. Historically this has only occurred that once. Then after the bear market was confirmed in 1953, the market turned on a dime and rallied to new highs within five months. The same exact thing just occurred in this market. This also suggests Cycle wave 1 is extending.
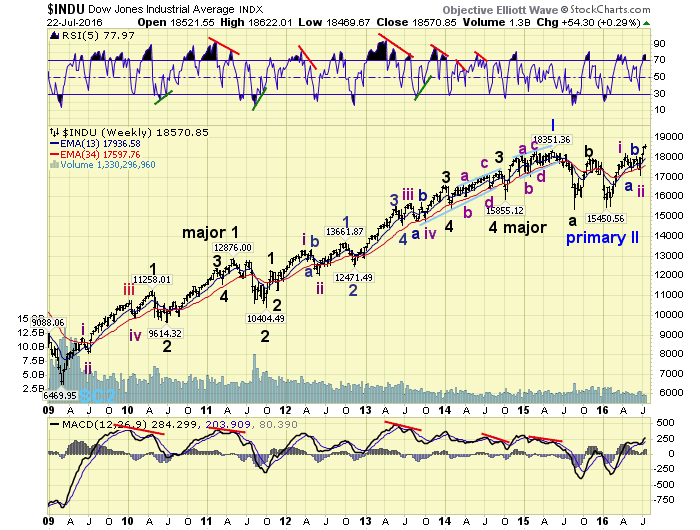
As a result we have added a third count and placed in on the DOW charts. This count suggests only Primary I ended in 2015, Primary II just completed in 2016, and Primary III, (all part of Cycle wave 1) is currently underway. In order for this count to gain in probability the SPX must again exceed 2335, the 1.618 times relationship to Primary A (2135-1810). Overall whether one is counting this advance as an ongoing next leg up Primary 5 or a new bull market Primary 3, really does not matter at this point. Both counts suggest five large waves up before a significant top is formed in the years ahead.
MEDIUM TERM: uptrend
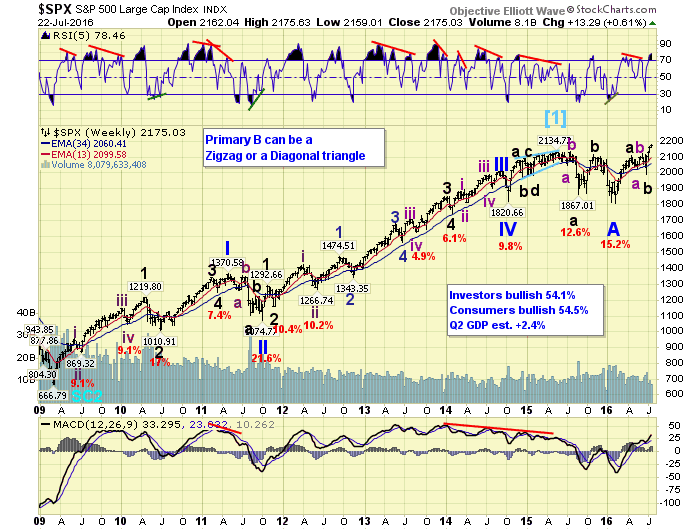
After the February low at SPX 1810 the market rallied in five waves to SPX 2111. Depending upon the long term count this could be labeled with an A or a 1. After that the market had a short downtrend to SPX 2026, a short uptrend to SPX 2121, then the Brexit downtrend to SPX 1992. Again depending upon the count this total action could be labeled either an irregular B or an irregular 2.
For the past four weeks the market has been uptrending. The SPX/DOW have already made new all time highs, while the NDX/NAZ/NYSE have yet to do so. Both the NYSE Primary V count, and the SPX Primary B count, suggest the NYSE will have to make new highs as well. The NYSE currently needs to rally about 4% to accomplish that. A 4% rally in the SPX is about 2250+, where we have targeted this uptrend to end. Then it gets interesting. We will get into those details as it unfolds. Medium term support is at the 2131 and 2085 pivots, with resistance at the 2177 and 2212 pivots.
SHORT TERM
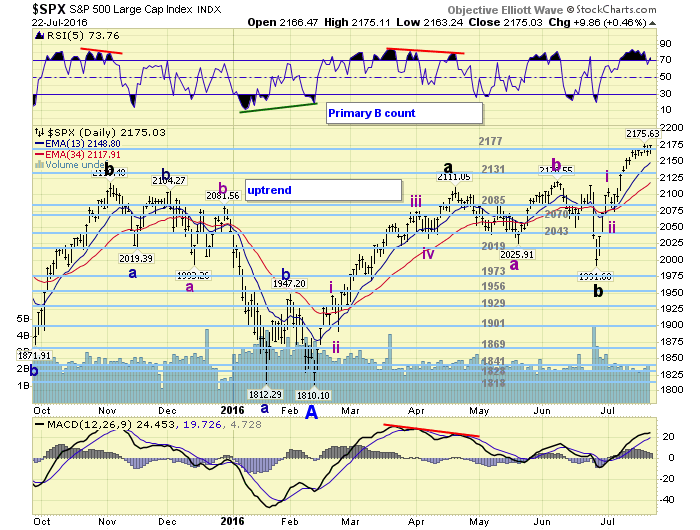
From the downtrend low at SPX 1992, about four weeks ago, the market has been advancing impulsively. The first several waves higher are quite clear. Intermediate waves i and ii at SPX 2109 and 2074 respectively, and small Minor waves 1 and 2 at SPX 2109 and 2089. Then it becomes a bit unclear in the SPX 2169-2177 area.
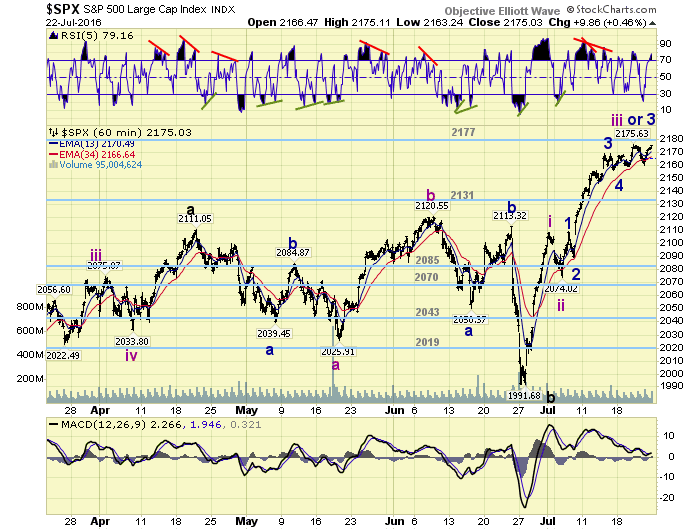
The SPX suggests Minor waves 3, 4 and 5, ending Intermediate iii at 2176, with Int. iv underway. The DOW suggests only Minor 3 ended at 2176, with only Minor 4 underway. Since Minor 2 was a 20 point decline, and Int. ii a 35 point decline, the recent 16 point decline (2176-2160) currently suggests it is only Minor 4. Especially if the market makes new highs without dropping below SPX 2160. If it does drop lower, into the lower SPX 2150’s, then the Int. wave iv count makes sense. Short term support is at the 2131 and 2085 pivots,, with resistance a the 2177 and 2212 pivots. Short term momentum rebounded from quite oversold on Thursday to end the week overbought.
FOREIGN MARKETS
Asian markets were mostly higher on the week for a net gain of 0.4%.
European markets were all higher and gained 0.8%.
The Commodity equity group were mixed but gained 0.4%.
The DJ World index gained 0.4%.
COMMODITIES
Bonds appear to be downtrending and lost 0.1%.
Crude is in a downtrend and lost 4.5%.
Gold is still in an uptrend but lost 1.1%.
The USD remains in an uptrend and gained 0.9%.
NEXT WEEK
Tuesday: consumer confidence, Case-Shiller, and new home sales. Wednesday: durable goods, pending home sales, and the FOMC meeting ends. Thursday: weekly jobless claims. Friday: Q2 GDP (est. +2.4%), Chicago PMI and consumer sentiment. Best to your weekend and week!
CHARTS: http://stockcharts.com/public/1269446/tenpp
After about 40 years of investing in the markets one learns that the markets are constantly changing, not only in price, but in what drives the markets. In the 1960s, the Nifty Fifty were the leaders of the stock market. In the 1970s, stock selection using Technical Analysis was important, as the market stayed with a trading range for the entire decade. In the 1980s, the market finally broke out of it doldrums, as the DOW broke through 1100 in 1982, and launched the greatest bull market on record.
Sharing is an important aspect of a life. Over 100 people have joined our group, from all walks of life, covering twenty three countries across the globe. It's been the most fun I have ever had in the market. Sharing uncommon knowledge, with investors. In hope of aiding them in finding their financial independence.
Copyright © 2016 Tony Caldaro - All Rights Reserved Disclaimer: The above is a matter of opinion provided for general information purposes only and is not intended as investment advice. Information and analysis above are derived from sources and utilising methods believed to be reliable, but we cannot accept responsibility for any losses you may incur as a result of this analysis. Individuals should consult with their personal financial advisors.
Tony Caldaro Archive |
© 2005-2022 http://www.MarketOracle.co.uk - The Market Oracle is a FREE Daily Financial Markets Analysis & Forecasting online publication.