


Gold and Silver Bull Phase 1 : Final Impulse Dead Ahead
Commodities / Gold and Silver 2016 Jul 30, 2016 - 03:51 PM GMTBy: Plunger

 Everything is now aligned for the final upward impulse to complete Phase I of the great bull market in the PM stocks. All the technical work is now done. The backing and filling complete. The final fuel stop taken to fill up on short sellers who will provide the fuel for the final surge powered by short covering. The psychology is properly set with several prominent newsletter writers having kept there subscriber base out and on the sidelines of the market. So let’s take a look at the weekly and daily gold price and see how it has been methodically taking all the healthy steps required to set-up for this rally’s completion.
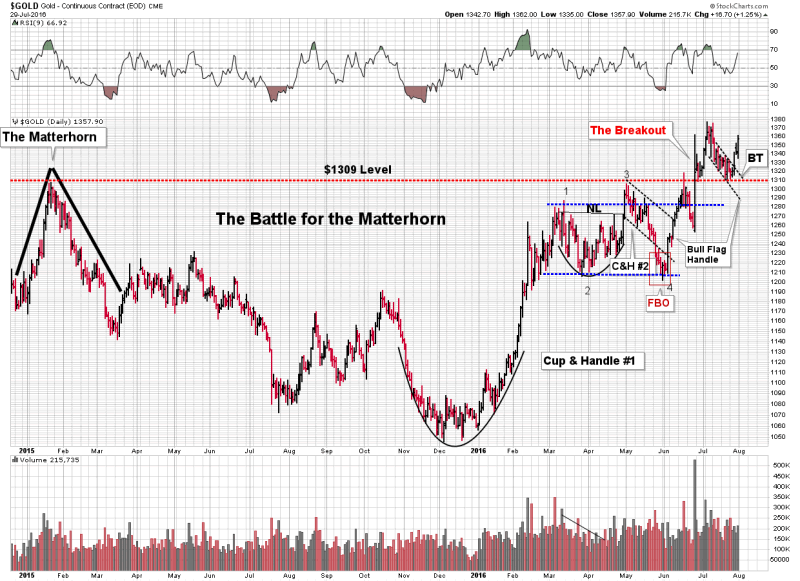
Here we see my daily Matterhorn chart where the methodical process of gold’s march higher is revealed. All the classic elements are here. The two cup and handles are quite evident. The $1309 matterhorn peak and resistance served to repel the advance two times. Note how the second attempt in mid June was a mini False Break Out with a quick intra day penetration, but it could not hold. Finally when we got the break out it was indeed on MASSIVE volume, just like it should be…classic. I use the word methodical to describe this process as gold then took the next 6 weeks to construct a double backtest to the $1309 breakout level. In character, it did this forming a clean bull flag correction from the beginning of July. This week we broke above that bull flag then appropriately backtested the flag, finishing the week with a strong advance. Folks it really doesn’t get cleaner and more methodical than this. The technicals of this chart more than anything argue that this is a bonafide bull market with explosive internal power. Also note the increasing volume in the daily gold chart. Take a step back and view it from a distance, this is the growth of volume in a bull market.
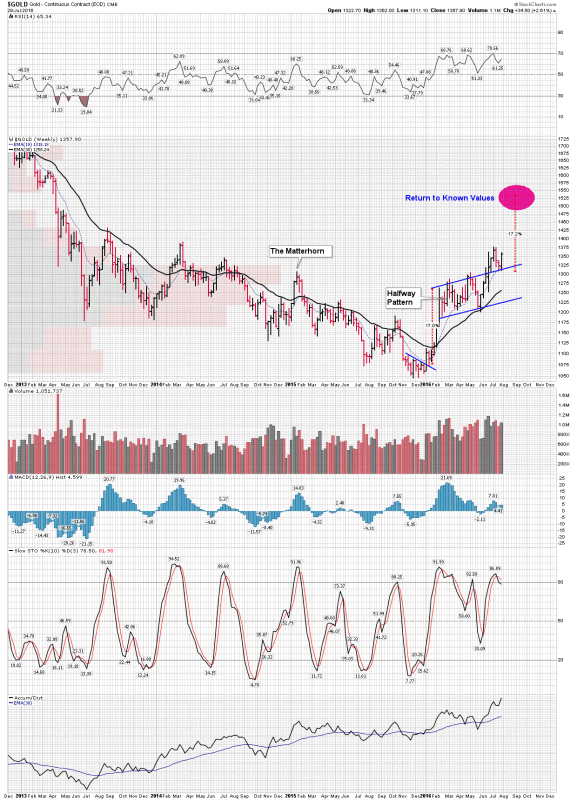
The next chart is the weekly gold chart where we can see a different weekly bull flag which may be a halfway pattern projecting a measured move to the mid-1500’s. It is my hypothesis that this is the level the gold price is seeking as it treks back to “Known Values” which fulfills the role of Phase I in a bull market. Later on Phase II will unfold where the general public and the financial institutions will come to recognize it as a bull market and will want in themselves. Until then its our private little party.
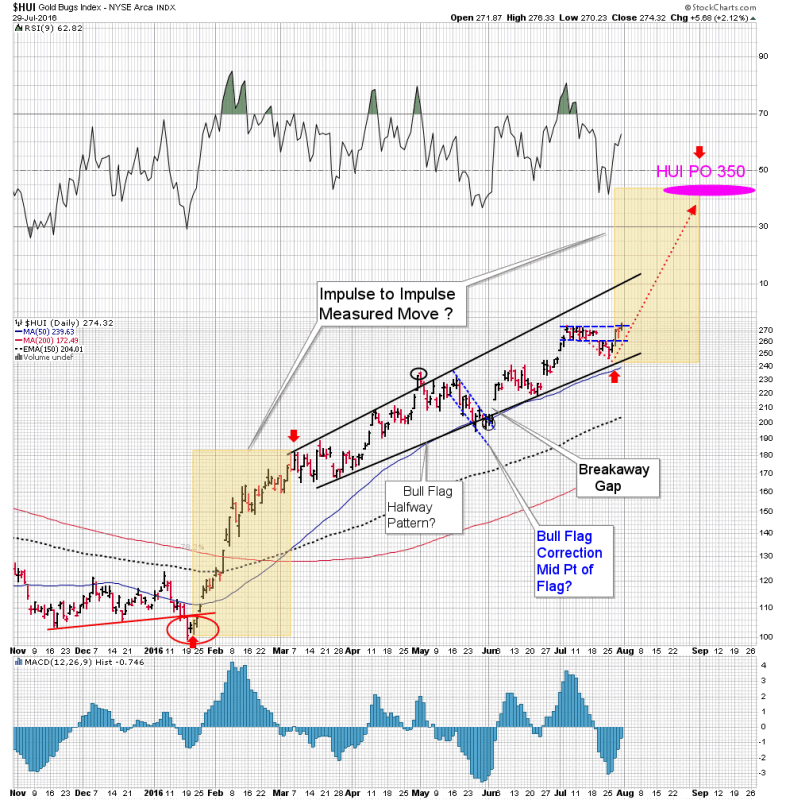
Next up we have two views of the HUI. First is the entire move since Phase I began on January 20 2016. The thesis I am working with is Phase I with its trek to known values projects to HUI 350 minimum. This move began with an upward impulse which morphed into an extremely strong upward bull flag consolidation. The bull flag may turn out to be a halfway pattern for the entire move. It even appears that within the bull flag consolidation we underwent a mid-point bull flag correction in the middle of May which lasted 2 weeks. If it was indeed a mid-point flag within the larger upward tilted bull flag that means that it has now timed out and is set to resume its accelerated move upward, This impulse move would be targeting the ultimate objective of Phase I of HUI 350 minimum.
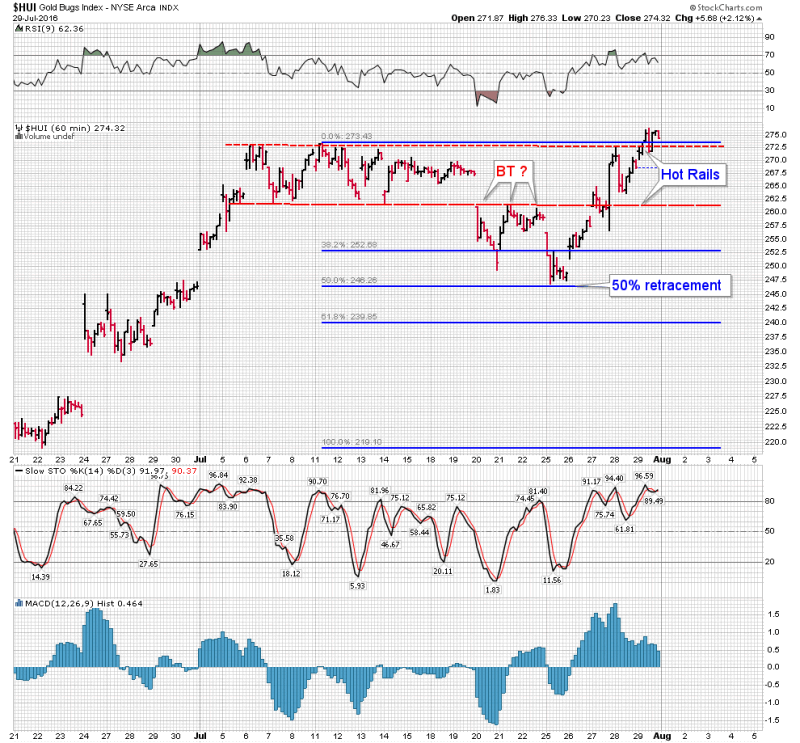
In the second HUI chart we focus on the most recent action using the one hour bar perspective. This is a very important chart IMO because it shows how the market may have set itself up for a short squeeze. On July 6 several well followed technical indicators flashed an upside exhaustion sell signal. I myself took chips off the table as a result of it. Many traders, looking for a deep correction actually shorted the PM stocks. The army of sidelined bystanders hoped for an extensive pullback so they could get on the train that they had missed since many newsletter writers had advised them to not to enter this market yet. Well, this hour chart shows how this very shallow correction played out. I based the FIBs off of the move from the bull flag support line starting 22 June. It retraced a classic 50% where support came in from the bull flag support line.
So here is the thing, this pullback was so short and shallow that I suspect the most of the sidelined watchers never got in. Also there still must be lots of short interest in the market. This is the perfect prescription for a final powerful quick move to the upside once we break through the upper bull flag resistance line. This area from HUI 290-345 has little resistance and should move quickly. Target range is 340-400 IMO . Good luck riding this Precious Metals Miner Baby Bull.
Plunger
Copyright © 2016 Plunger - All Rights Reserved
All ideas, opinions, and/or forecasts, expressed or implied herein, are for informational purposes only and should not be construed as a recommendation to invest, trade, and/or speculate in the markets. Any investments, trades, and/or speculations made in light of the ideas, opinions, and/or forecasts, expressed or implied herein, are committed at your own risk, financial or otherwise. The information on this site has been prepared without regard to any particular investor’s investment objectives, financial situation, and needs. Accordingly, investors should not act on any information on this site without obtaining specific advice from their financial advisor. Past performance is no guarantee of future results.
© 2005-2022 http://www.MarketOracle.co.uk - The Market Oracle is a FREE Daily Financial Markets Analysis & Forecasting online publication.