Gold Bull Market or just a Bear Market Rally?
Commodities / Gold and Silver 2016 Jul 31, 2016 - 12:59 PM GMTBy: Tony_Caldaro
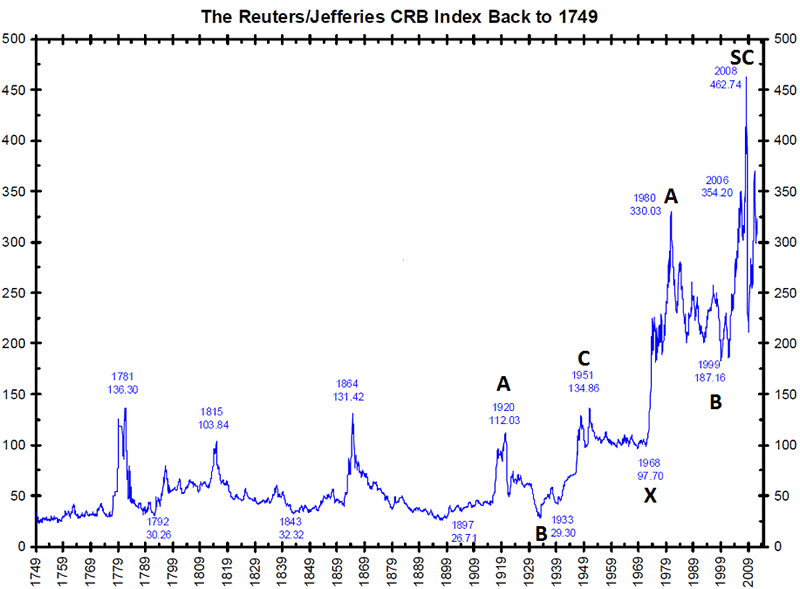
 While many are touting a new bull market in Gold, and Silver for that matter, history suggests otherwise. When we look back at the history of commodity prices for the past two centuries we observe generally short bull markets followed by longer bear markets. Since Gold was fixed for most of this period a chart going that far back would be of little use.

Notice for over 200 years commodities remained in a trading range. Demand drove prices up, then oversupply brought prices right back down. This all changed when the US went off the Gold standard in 1971. Commodity prices soared, along with Gold, and the bull/bear cycles became more uniform.

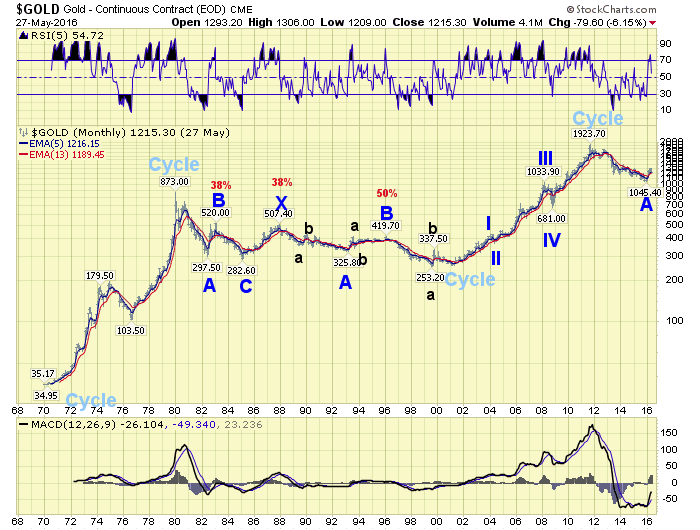
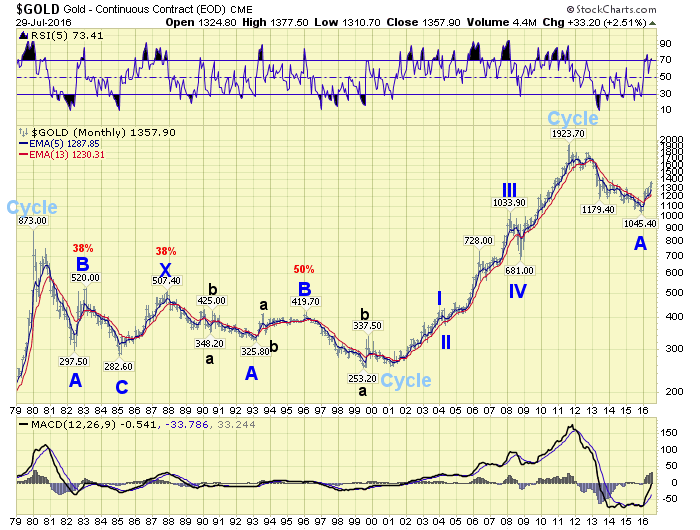
Gold has had two bull markets since then: 1970-1980, and 2001-2011. In between was a lengthy two decade bear market. The same pattern, with slightly altered dates, can be found in most of the commodities. For example, Crude had a bull market from 1970-1980 and another bull market from 1998-2008. In between was a lengthy two decade bear market. And Crude is currently still well below its bull market high of $147/bbl.

When we examine the last Gold bear market in detail we find it had three significant rallies during its 1980-2001 bear market. One in the early 1980’s, another in the mid-80’s, and the third in the mid-90’s. The first two rallies retraced only 38.2% of the previous larger declines, and the last retraced about 50%.

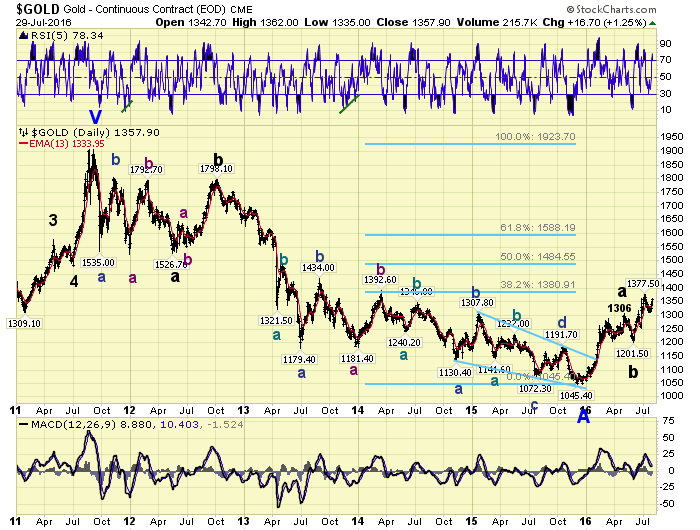
If we then apply these retracement levels to the current bear market rally we arrive at some interesting potential price targets. A 38.2% retracement of the entire 2011-2015 decline is $1381, and a 50% retracement is $1485. Since Gold has already risen to $1377, and if it clears the $1381 level, the 50% retracement level is probably the target. If we then compare the three waves within this advance we find that Major C equals Major A at $1463. This gives us an upside target for the entire bear market rally between $1463 and $1485 in the weeks and months ahead.
This is just an observation based upon historical and current wave formations, and not a trading or investment recommendation. You can follow Gold along with us using the following link: https://stockcharts.com/public/1269446/tenpp/10
After about 40 years of investing in the markets one learns that the markets are constantly changing, not only in price, but in what drives the markets. In the 1960s, the Nifty Fifty were the leaders of the stock market. In the 1970s, stock selection using Technical Analysis was important, as the market stayed with a trading range for the entire decade. In the 1980s, the market finally broke out of it doldrums, as the DOW broke through 1100 in 1982, and launched the greatest bull market on record.
Sharing is an important aspect of a life. Over 100 people have joined our group, from all walks of life, covering twenty three countries across the globe. It's been the most fun I have ever had in the market. Sharing uncommon knowledge, with investors. In hope of aiding them in finding their financial independence.
Copyright © 2016 Tony Caldaro - All Rights Reserved Disclaimer: The above is a matter of opinion provided for general information purposes only and is not intended as investment advice. Information and analysis above are derived from sources and utilising methods believed to be reliable, but we cannot accept responsibility for any losses you may incur as a result of this analysis. Individuals should consult with their personal financial advisors.
Tony Caldaro Archive |
© 2005-2022 http://www.MarketOracle.co.uk - The Market Oracle is a FREE Daily Financial Markets Analysis & Forecasting online publication.


