


Stock Market SPX Downtrend Underway
Stock-Markets / Stock Markets 2016 Sep 10, 2016 - 06:48 PM GMTBy: Tony_Caldaro

 Another boring week until Friday. The market started the week at SPX 2180. After opening at SPX 2184 on Tuesday, it dropped to 2175 in the first hour of trading, then hit a higher high at the close. On Wednesday the SPX hit the high for the week at 2188. After that it declined into the close on Friday. For the week the SPX/DOW lost 2.3%, and the NDX/NAZ lost 2.4%. Economic reports for the week were light and slightly positive. On the downtick: ISM services and the Q3 GDP estimate. On the uptick: consumer credit, investor confidence, and weekly jobless claims improved. Next week, another options expiration week, reports will be highlighted by industrial production, the CPI/PPI and retail sales. Best to your week!
LONG TERM: uptrend
Quite an interesting market. While the free market enthusiasts continue to complain about the central bank interventions. The bulls and the bears had been locked in a 1.5% trading range for the past eight weeks. Last Friday FED chair Yellen, in her Jackson Hole speech, suggested no rate hikes until at least December. Right after her speech, in an interview with vice chairman Fischer, he, and a chorus of other Fed officials this week, suggested a rate hike could be on the table as soon as this month. Then on Thursday, when the ECB president Mario Draghi failed to meet market expectations of an expansion in the EQE program, the markets began to selloff. Notice what is driving these markets. It’s not fundamentals, which remain moderately positive. It’s central bank rhetoric!
The long term view remains unchanged. The key US indices are in long term uptrends. While many of the foreign markets, and secondary US indices, appear to be in long term uptrends as well. We continue to carry three counts on the US markets displayed on the SPX, NYSE and DOW charts. Last week we upgraded the most bullish count to a 40% probability, and placed a 30% probability on the other two counts. See previous weekend updates for details. In summary.
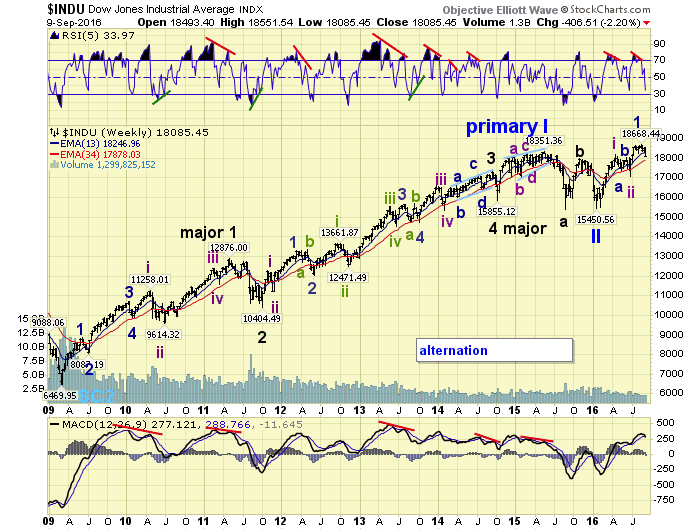
The DOW count suggests a new bull market began in February 2016.
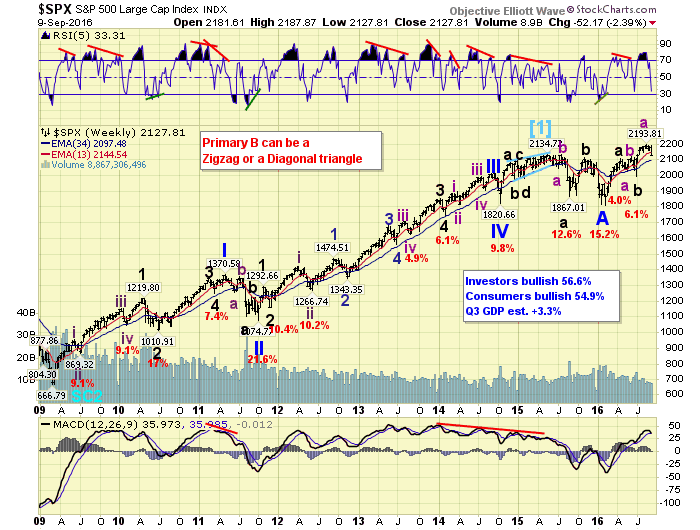
The SPX count suggests an irregular ongoing bear market has been underway since 2015.
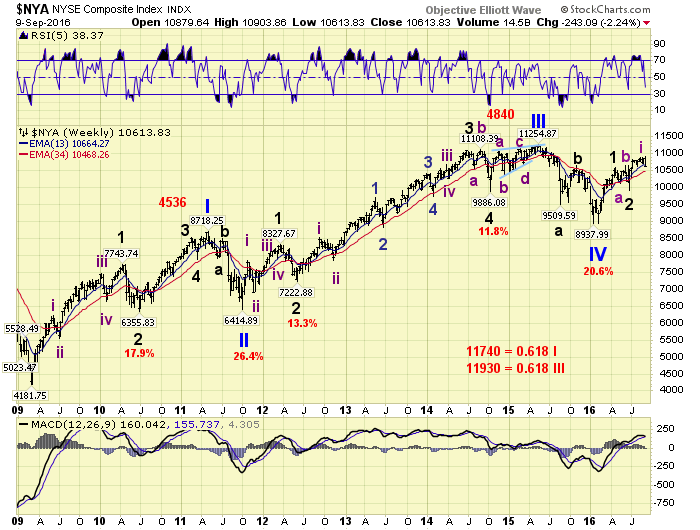
The NYSE count suggests the bull market from 2009 is still underway, and will not likely end until this index makes new all time highs.
MEDIUM TERM: downtrend
As noted above. For the past eight weeks the SPX had remained in a record 1.5% trading range. This week the NDX/NAZ/NYSE all made new uptrend highs. Yet, the SPX/DOW had not made an uptrend high in nearly four weeks: since August 15th. When short term selling began on Thursday, due to the ECB disappointment, this negative divergence came into play. As a result the indices moved more in one day, than it had moved in the last eight weeks.
As a result of Friday’s selloff all four major indices are in confirmed downtrends. The uptrend from the late-June Br-exit low did complete five waves up, with the fifth wave ending in an expanding diagonal triangle. Friday’s selloff confirmed the count and this new pattern.
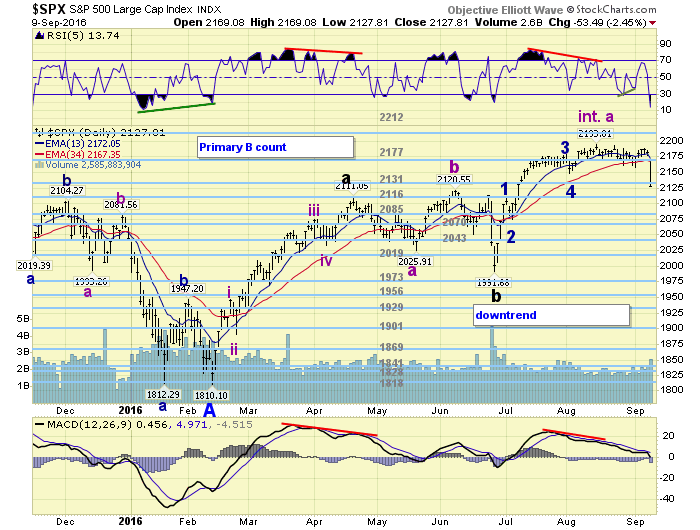
With a downtrend underway there are several levels of support right under the market. Fibonacci retracement levels suggest the following SPX: 2117 (38.2%), 2093 (50.0%) and 2069 (61.8%). Since the fifth wave was the weakest wave there is support between waves 1 and 2, SPX: 2074-2109. Then we have the OEW pivots. In our review of the 2015-2016 bear market we uncovered a few new pivots. Therefore pivot support is at SPX: 2116, 2085 and 2070. Combining all these levels the first support is the 2116 pivot range, second the 2085 pivot range, and third the 2070 pivot range. All that analysis and it still leads to the three pivots. Medium term support is at the 2116 and 2085 pivots, with resistance at the 2131 and 2177 pivots.
SHORT TERM
During the uptrend we had noticed that wave three was shorter than wave one. This suggested that wave five would be the shortest wave. And it was. What we didn’t figure was that it would be so short and take over one month to unfold. But I guess neither did anyone else.
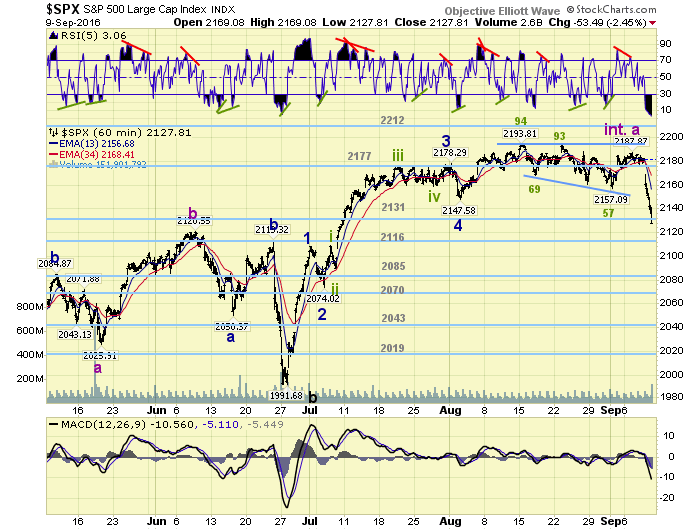
Since Friday provided a very sharp selloff we do not think this downtrend is going to last too long. Hourly and daily RSI are already extremely oversold. Plus the weekly RSI is already close to the low of the last downtrend. Should the downtrend continue lower over the next day or so it could bottom. If the market bounces Monday/Tuesday it is likely to require a retest of the lows before bottoming. Either way next week could be a reversal week for the downtrend. Short term support is at the 2116 and 2085 pivots, with resistance at the 2131 and 2177 pivots. Short term momentum ended the week extremely oversold. Trade what’s in front of you!
FOREIGN MARKETS
Asian market were mixed on the week for a gain of 0.7%.
European markets were mostly lower for a loss of 0.8%.
The Commodity group were mixed and gained 0.6%.
The DJ World index lost 1.2%.
COMMODITIES
Bonds continue to downtrend and lost 0.4% on the week.
Crude appears to be in a volatile uptrend and gained 3.2%.
Gold appears to be in an uptrend too and gained 0.6%.
The USD is still in a downtrend and lost 0.6%.
NEXT WEEK
Monday: a speech from FED governor Brainard at 1:15. Tuesday: the budget deficit. Wednesday: export/import prices. Thursday: weekly jobless claims, retail sales, the PPI, the Philly/NY FED, industrial production and business inventories. Friday: the CPI, consumer sentiment and options expiration. Best to your weekend and week!
CHARTS: http://stockcharts.com/public/1269446/tenpp
After about 40 years of investing in the markets one learns that the markets are constantly changing, not only in price, but in what drives the markets. In the 1960s, the Nifty Fifty were the leaders of the stock market. In the 1970s, stock selection using Technical Analysis was important, as the market stayed with a trading range for the entire decade. In the 1980s, the market finally broke out of it doldrums, as the DOW broke through 1100 in 1982, and launched the greatest bull market on record.
Sharing is an important aspect of a life. Over 100 people have joined our group, from all walks of life, covering twenty three countries across the globe. It's been the most fun I have ever had in the market. Sharing uncommon knowledge, with investors. In hope of aiding them in finding their financial independence.
Copyright © 2016 Tony Caldaro - All Rights Reserved Disclaimer: The above is a matter of opinion provided for general information purposes only and is not intended as investment advice. Information and analysis above are derived from sources and utilising methods believed to be reliable, but we cannot accept responsibility for any losses you may incur as a result of this analysis. Individuals should consult with their personal financial advisors.
Tony Caldaro Archive |
© 2005-2022 http://www.MarketOracle.co.uk - The Market Oracle is a FREE Daily Financial Markets Analysis & Forecasting online publication.