


Stock Market Correction Already Over?
Stock-Markets / Stock Markets 2016 Sep 18, 2016 - 06:34 PM GMTBy: Andre_Gratian

 Current Position of the Market
SPX Long-term trend: The long-term trend is up but weakening. Potential final phase of bull market.
SPX Intermediate trend: The uptrend from 1810 continues, but it has entered a corrective phase.
Analysis of the short-term trend is done on a daily basis with the help of hourly charts. It is an important adjunct to the analysis of daily and weekly charts which discuss longer market trends.
Daily market analysis of the short term trend is reserved for subscribers. If you would like to sign up for a FREE 4-week trial period of daily comments, please let me know at ajg@cybertrails.com
Correction Already Over?
Market Overview
It certainly looks as if it could be over in a couple of days! If so, the “real” correction has not yet started and we may have to reach 2250 before a more important decline takes hold. The question will then be: “Is the bull market finally over?” But that’s in the future. Let’s get back to now!
There are many signs pointing to the possibility that this correction is over. Positive divergence is showing in some daily indicators; a P&F base has been built at the 2120 level which already carries enough of a count to reach the 2250 level; this is suggested by the chart pattern, and even the structure which smacks of a completed wave 4 from 1810. Corroborating factors are also present in the fact that decline retraced .382 of the uptrend from 1992, filing a P&F count which I thought might be only a phase count but which could, instead, be a measure of the entire decline.
These positives are offset by a couple of important negatives: one is that, according to Erick Hadik (insiide@aol.com), the intermediate cycle pattern does not fit a resumption of the uptrend to a new high at this time. Instead, he expects a sharp decline into the end of the month. The other is that the daily MACD does not show divergence and does not look ready to support a reversal higher. So we’ll have to see what the market has to say about its near-term direction.
There is also a fairly reliable short-term cycle which is scheduled to make its low on Tuesday/Wednesday.
Analysis (This chart and others below, are courtesy of QCharts.com.)
Daily chart
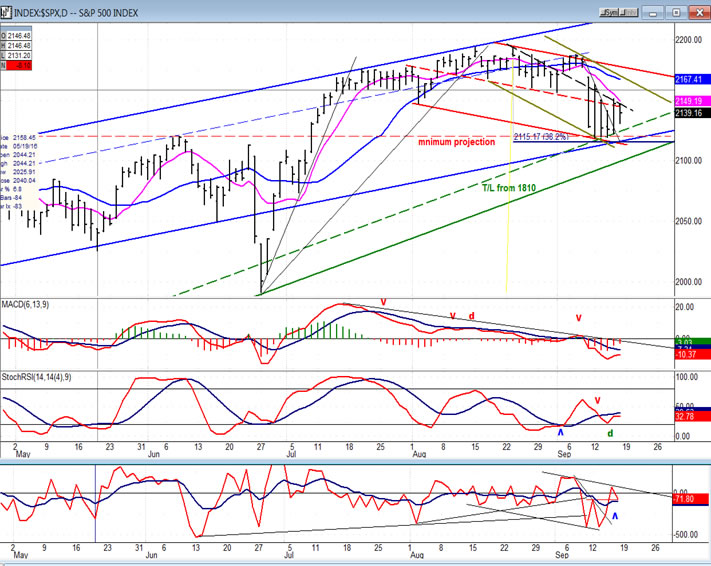
In the last letter, I pointed out that we were fast approaching an important support level at about 2120 which could arrest the decline, at least temporarily. It consisted of a .382 retracement from 1992, the junction of several trend lines, and the presence of recent short-term peaks made by the index. This proved to be correct as SPX tried to pierce through that support on Monday, Wednesday and Thursday of last week, but all attempts failed, and by Friday, it looked as if we were already starting a new uptrend.
The pattern that was made by the correction can be reduced to a couple of channels. In the longer of the two (red) I have drawn a mid-channel line (dashed) which has stopped all the bounces from the base. The first sign that a new uptrend is on the way will be when we break above that mid-channel line and go on to challenge the top one. A break through the top of that channel could easily surpass the 2193 high. If, on the other hand the advance is contained and a reversal drives prices back below the dashed line, we will have to re-evaluate what the market wants to do.
I had also mentioned earlier that the SRSI had already started to move up when the correction arrived and although it was turned, it remained well above its previous low and turned back up after creating some positive divergence. Note also that the slower blue MA bottomed two weeks ago and kept on rising throughout the entire decline. There was also good movement in the A/D indicator which has already challenged the top of its corrective channel, but has not yet broken above. These are only preparatory indications that an uptrend is about to start, but the MACD is lagging, so we don’t yet have a convincing bullish picture. It should sort itself out in the next few days, after which we’ll have a better idea of where we are.
Hourly chart
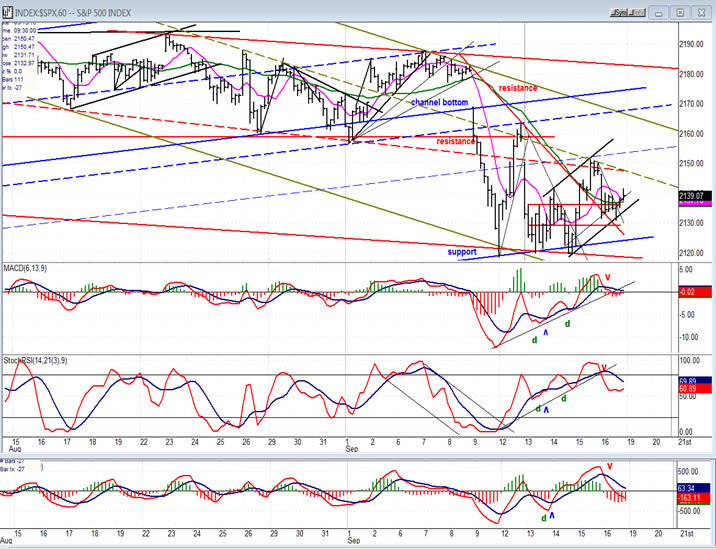
The points of contact of the parallels which form the channels, as well as support and resistance lines are easier to see on this chart. For instance, we can see why the first rally from the 2120 low stopped where it did: right on the dashed blue parallel. On Thursday, SPX broke its first minor downtrend line and found resistance on the dashed parallel of the green channel which caused it to retrace. On Friday, it back -tested the broken minor trend line where it found support and bounced. The key to market direction will come over the next few days. Will the index continue to move up, or will it retrace one more time? And if it does, will the 2120 level hold once again?
In order to make a new high, the index needs to rise above the top of the red channel. If it cannot do that, we should be on the alert for a possible extension of the current correction.
The oscillators may be in a precarious position because, if prices rise higher, they will stand a good chance of creating negative divergence which would then signal a short-term reversal in the index. They may also already have given a sell signal which implies further weakness So, in spite of all the positive signs that we should be ready for another advance, we will need to pay close attention to the market action over the next few days.
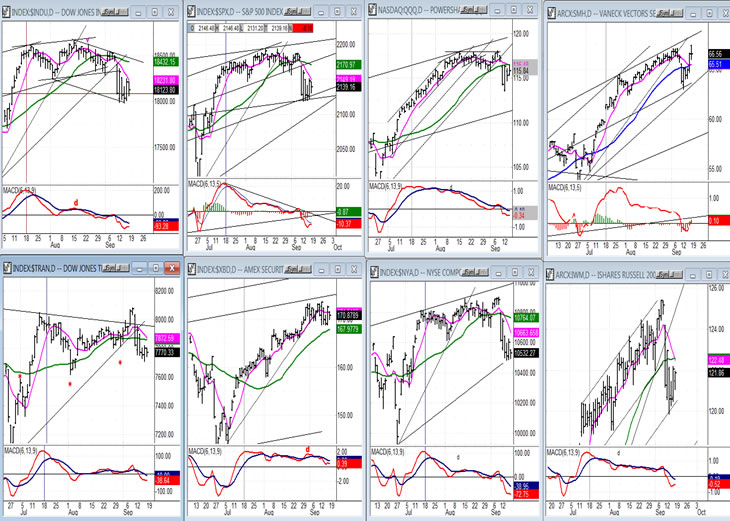
- Some leading & confirming indexes (Daily charts)
- The DJIA (top left) has the same consolidation pattern as the SPX. I have yet to draw all the important trend lines for each index, but will by next week. The overall picture is still pretty much of a mixed bag, but strength in XBD, which did a good job of resisting the decline, and also TRAN which was relatively stronger than DJIA, could be an indication of additional market strength.
-
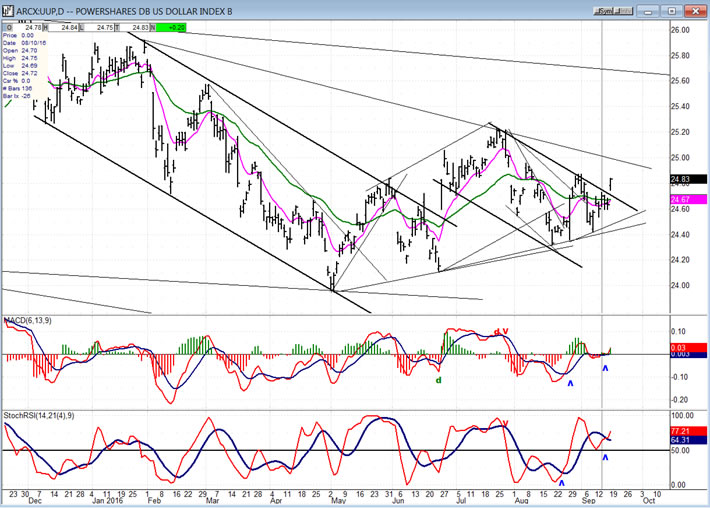
- UUP (dollar ETF)
- On Friday UUP broke out of its corrective channel. If it is resuming its uptrend – which has been struggling since the May low – it must now expand its move not only beyond the downtrend line, but above the 25.00 level. Is there something lurking in the shadows that would cause it to do that? Perhaps a statement by the Bank of Japan which is due in a few days? If so, this would have repercussion for the market, and gold.
-
- GDX (Gold Miners ETF)
- GDX is hanging for dear life just above its former correction low. A daily close below the red line (which was tested on Friday and held) would then challenge that low and lead to another down-draft that could reach about 23.00.
-
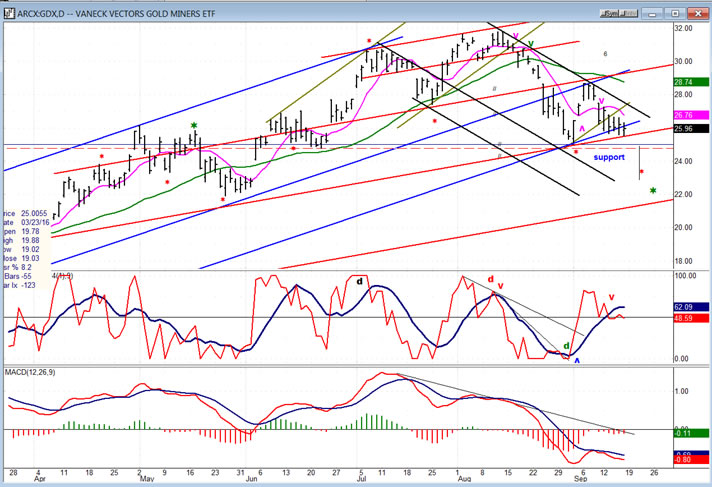
- Note: GDX is now updated for subscribers several times throughout the day along with SPX, on Marketurningpoints.com.
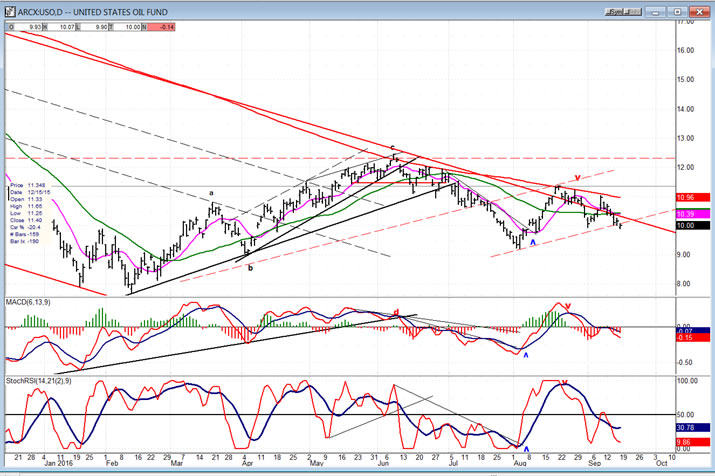
- USO (U.S. Oil Fund)
- UUP continues to struggle with the overhead resistance which hovers directly above in the form of a channel line and the 200-day MA. Even if it were to overcome these soon, as is implied by the bottoming oscillators, the resistance just above 12.00 which stopped its original rebound from a long-term low will be waiting for a chance to repel a second attempt at moving higher.
Summary
The short-term technical picture is a mixture of positives and negatives. We must wait for a clearer indication of the market’s intention, and this should come over the next few days.Andre
FREE TRIAL SUBSCRIPTION
If precision in market timing for all time framesis something that you find important, you should
Consider taking a trial subscription to my service. It is free, and you will have four weeks to evaluate its worth. It embodies many years of research with the eventual goal of understanding as perfectly as possible how the market functions. I believe that I have achieved this goal.
For a FREE 4-week trial, Send an email to: info@marketurningpoints.com
For further subscription options, payment plans, and for important general information, I encourage
you to visit my website at www.marketurningpoints.com. It contains summaries of my background, my
investment and trading strategies, and my unique method of intra-day communication with
subscribers. I have also started an archive of former newsletters so that you can not only evaluate past performance, but also be aware of the increasing accuracy of forecasts.
Disclaimer - The above comments about the financial markets are based purely on what I consider to be sound technical analysis principles uncompromised by fundamental considerations. They represent my own opinion and are not meant to be construed as trading or investment advice, but are offered as an analytical point of view which might be of interest to those who follow stock market cycles and technical analysis.
Andre Gratian Archive |
© 2005-2022 http://www.MarketOracle.co.uk - The Market Oracle is a FREE Daily Financial Markets Analysis & Forecasting online publication.