


Strongly Bullish US Equity Markets Will Drive Stock Markets
Stock-Markets / Global Stock Markets Oct 03, 2016 - 03:29 PM GMTBy: John_Mesh

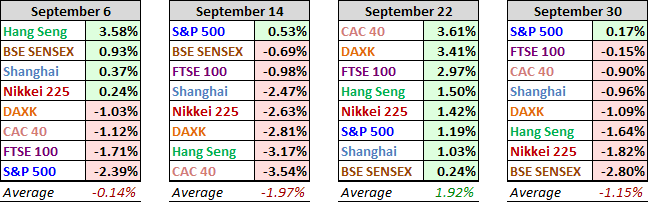
 Only one of the eight indexes on our world watch list posted a week-over-week advance, down from eight up the previous week. The S&P 500 was the sole winner with a fractional 0.17% gain. India's SENSEX was the biggest loser at -2.80%. The -1.15% average of the eight contrasts sharply with the 1.92% average for the previous week. The tables below provide a concise overview of performance comparisons over the past four weeks for these eight major indexes. We've also included the average for each week so that we can evaluate the performance of a specific index relative to the overall mean and better understand weekly volatility. The colors for each index name help us visualize the comparative performance over time.
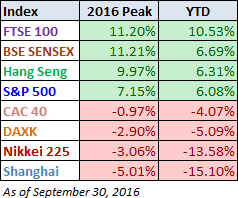
Here is a table of the 2016 performance, sorted from high to low, along with the most recent highs for the eight indexes. Four indexes are in the green year-to-date, unchanged from last week. Somewhat ironically in light of BREXIT, the UK's FTSE is the top performer, by nearly 4%. China's Shanghai remains in the cellar.
Economy: Good tracktion continues
ATA trucking index has risen sharply in August.
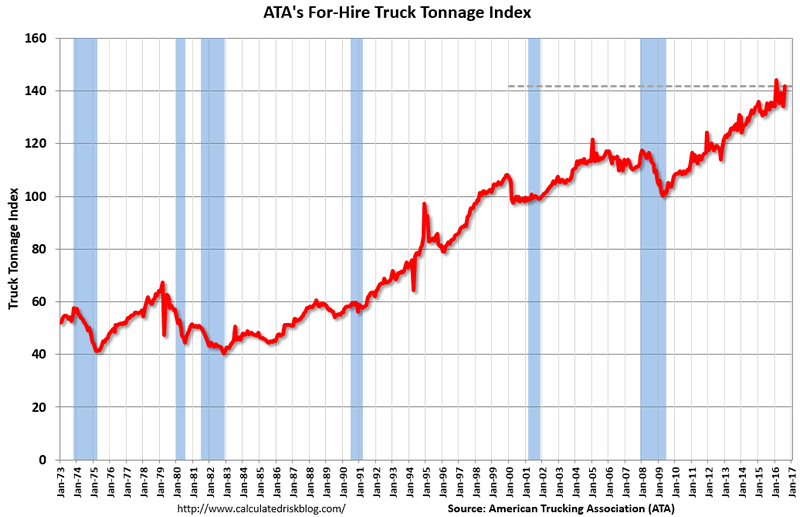
The trucking index is now up 5.9% year-over-yea
American Trucking Associations’ advanced seasonally adjusted (SA) For-Hire Truck Tonnage Index increased 5.7% in August, following a 2.1% decline during July. In August, the index equaled 141.8 (2000=100), up from 134.2 in July. The all-time high was 144 in February. Compared with August 2015, the SA index rose 5.9%, the largest year-over-year gain since May also 5.9%. In July, the year-over-year increase was 0.2%. Year-to-date, compared with the same period in 2015, tonnage was up 3.5%. “Volatility continues to reign in 2016. This month’s tonnage reading highlights this fact and underscores the difficulty in determining any real or clear trend in truck tonnage,” said ATA Chief Economist Bob Costello. “What is clear to me is that normal seasonal patterns are not holding in 2016.”. “Despite a difficult to read August, I expect the truck freight environment to be softer than normal as well as continued choppiness until the inventory correction is complete. With moderate economic growth forecasted, truck freight will improve as progress is made with the inventory overhang,” he said.
A very good summary we often tend to use for our analysis is the char provided by Jeff Miller at Dash of Insight.
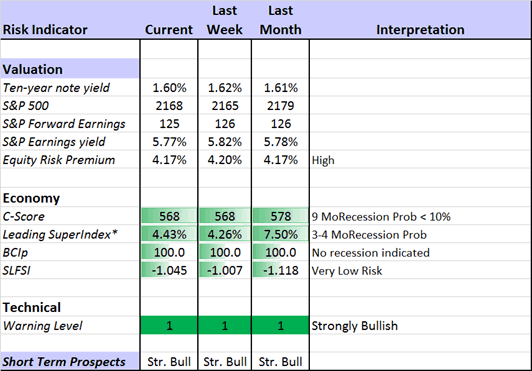
The market is now showing bullish tendency on technical scoring and fundamental basis.
Bob Dieli: The “C Score” which is a weekly estimate of his Enhanced Aggregate Spread (the most accurate real-time recession forecasting method over the last few decades). His subscribers get Monthly reports including both an economic overview of the economy and employment. The recession odds (in nine months) have nudged closer to 10%.
Georg Vrba: The Business Cycle Indicator, and much more. Check out his site for an array of interesting methods. Georg regularly analyzes Bob Dieli’s enhanced aggregate spread, considering when it might first give a recession signal. Georg thinks it is still a year away. It is interesting to watch this approach along with our weekly monitoring of the C-Score.
Brian Gilmartin: Analysis of expected earnings for the overall market as well as coverage of many individual companies.
RecessionAlert: Many strong quantitative indicators for both economic and market analysis. While we feature his recession analysis, Dwaine also has a number of interesting approaches to asset allocation.
Clearly, fundamentally and technically market is well placed to move higher.
We also take a look at some key technical charts and patterns.
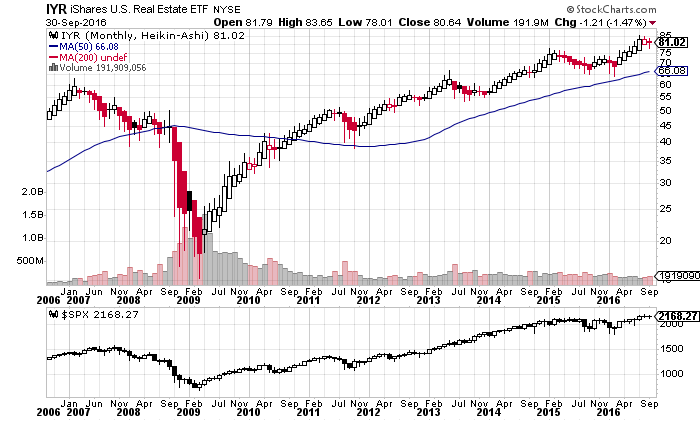
The IYR -real estate - has seen volumes pickup on the downmove and ended the month weak on sustained selling. Generally two months of weakness is often followed by more weakness which can stretch
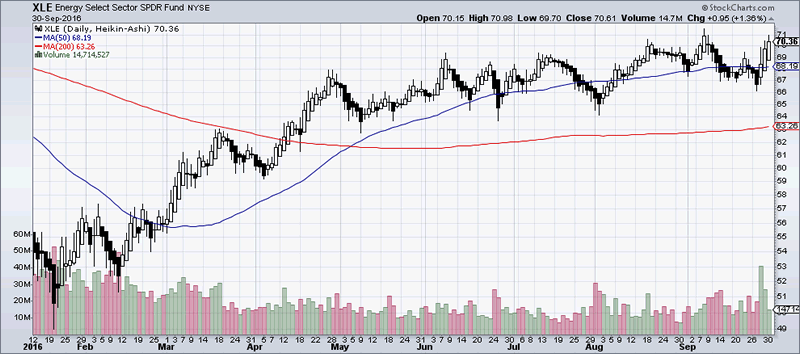
The XLE (Energy) sector has risen strongly on big volumes. Market is positioning for moves in energy.
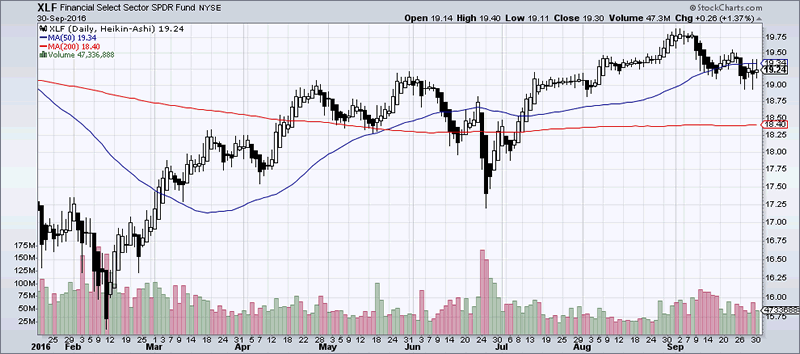
The XLF was weak last week. We highlighted this in last week research updates. The XLF is a barometer of market strength. Weakening financials will suppress a bull market. However friday price action suggest waning bearish momentum. We can wait monday to see how this picks up.
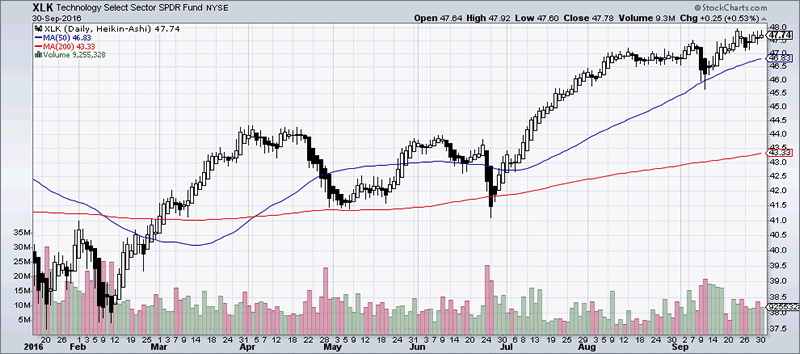
The tech ETF is neutral.
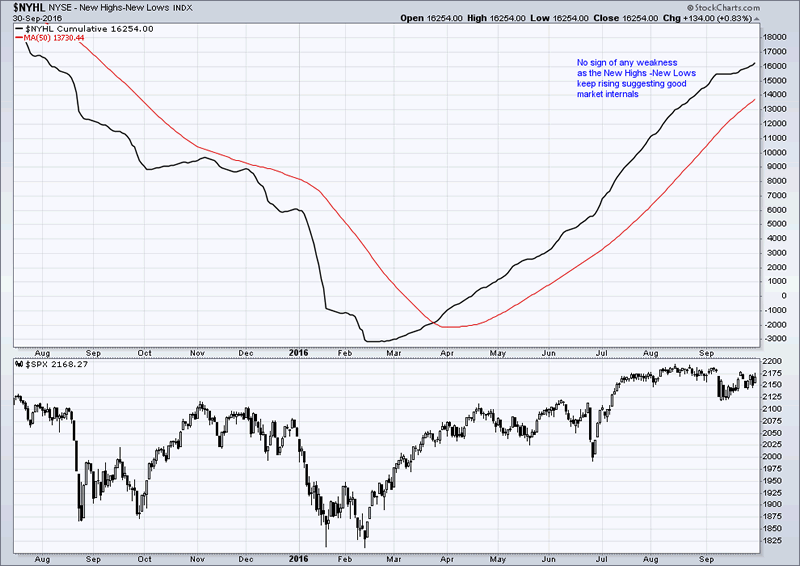
The NYHL shows the market bullishness calculated stock wise. It is the difference of stocks making new highs to new lows. Before a market corrects, less and less number of stocks will make new highs and hence we watch this for any portending weakness. We find none as of now and hence all clear for further rise for the equity markets.
Final Summary: We continue to be bullish the broader risk assets. How this plays in the forex and the bond markets is something we watch out for.
JM is the partner at FXMesh. Over 15 years of trading, hedge fund and research experince background, he now provides investment advice and economic reasearch to clients around the world from his site http://fxmesh.com
He has worked at some of the most marquee names in trading and hedge fund industry. He invented the MESH Framework of trading. He will also like publish regular free articles at marketoracle for benefit of the readers.
Copyright 2016 John Mesh. All rights reserved.
Disclaimer: The above information is not intended as investment advice. Market timers can and do make mistakes. The above analysis is believed to be reliable, but we cannot be responsible for losses should they occur as a result of using this information. This article is intended for educational purposes only. Past performance is never a guarantee of future performance.
© 2005-2022 http://www.MarketOracle.co.uk - The Market Oracle is a FREE Daily Financial Markets Analysis & Forecasting online publication.