


Stock Market Season of Falling Prices and Percent Index Proves It!
Stock-Markets / Stock Markets 2016 Oct 05, 2016 - 03:40 PM GMTBy: Chris_Vermeulen

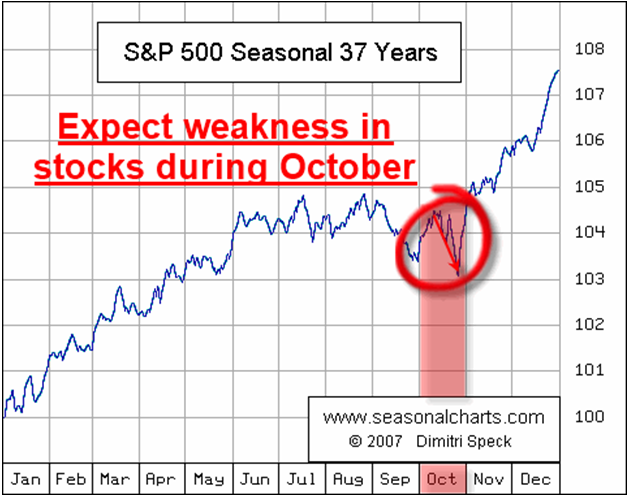
 It’s a knows fact that Sept and October are typically weak times for US stocks. Going back 37 years shows us the tendency for investors to sell and rebalance their portfolios to try and perform better during the final quarter.
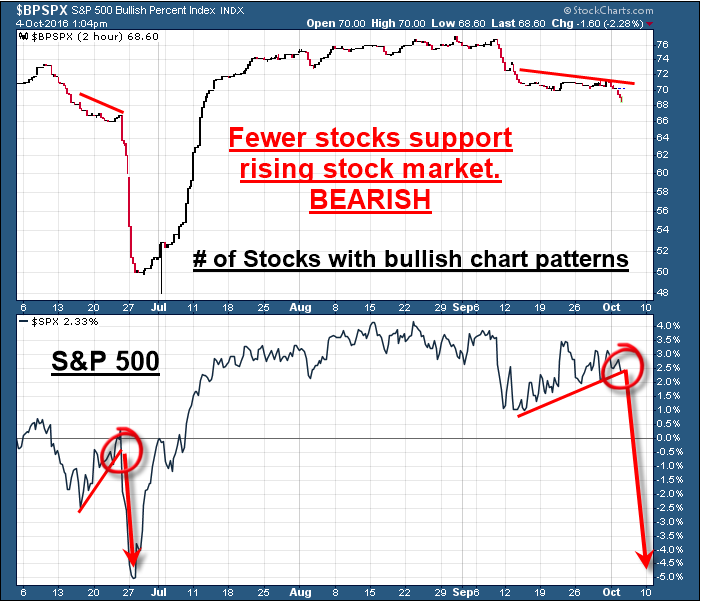
But that’s not really the point of this article. The chart below shows a comparison between the SP500 bullish percent index and the SP500 index.
What is a bullish percent index?
in short, it’s based on point-and-figure charts and is one of the oldest and simplest stock charting tools to help identify the overall market strength or weakness. This index shows us how many stocks have generated a buy signal within the group of stocks its tracks.
Bullish Percent Index Proves Market Is Weakening:
The chart below shows the bullish percent index at the top and the SP500 at the bottom. I think the charts paint a clear picture of what is taking place. Currently the BPI is trending lower and picking up speed, while the SP500 index has been rising. This means fewer and fewer stocks are holding the stock market up and this typically ends with a sharp market correction. The last time we saw this was in June.
In fact, the drop in gold miners of 10% on Tuesday and the pullback in the SP500 I talked about it happening the day prior in a conversation with Kerry Lutz and also shared what we should expect next.
The Time of Year Stocks Correct:
Below is the seasonal chart of the SP500 taking into account all monthly price movements over a 37 year period. September is usually weak which it close lower for the month and so is October.
Concluding Thoughts:
In short, stocks are under pressure for the month of October. I expect increased volatility, and large intraday price swings to be more of the norm.
Stay tuned for my next update on the crashing metals and gold miners report next, and be sure to follow my trades at: www.TheGoldAndOilGuy.com
Chris Vermeulen
Chris Vermeulen is Founder of the popular trading site TheGoldAndOilGuy.com. There he shares his highly successful, low-risk trading method. For 7 years Chris has been a leader in teaching others to skillfully trade in gold, oil, and silver in both bull and bear markets. Subscribers to his service depend on Chris' uniquely consistent investment opportunities that carry exceptionally low risk and high return.
Disclaimer: Nothing in this report should be construed as a solicitation to buy or sell any securities mentioned. Technical Traders Ltd., its owners and the author of this report are not registered broker-dealers or financial advisors. Before investing in any securities, you should consult with your financial advisor and a registered broker-dealer. Never make an investment based solely on what you read in an online or printed report, including this report, especially if the investment involves a small, thinly-traded company that isn’t well known. Technical Traders Ltd. and the author of this report has been paid by Cardiff Energy Corp. In addition, the author owns shares of Cardiff Energy Corp. and would also benefit from volume and price appreciation of its stock. The information provided here within should not be construed as a financial analysis but rather as an advertisement. The author’s views and opinions regarding the companies featured in reports are his own views and are based on information that he has researched independently and has received, which the author assumes to be reliable. Technical Traders Ltd. and the author of this report do not guarantee the accuracy, completeness, or usefulness of any content of this report, nor its fitness for any particular purpose. Lastly, the author does not guarantee that any of the companies mentioned in the reports will perform as expected, and any comparisons made to other companies may not be valid or come into effect.
Chris Vermeulen Archive |
© 2005-2022 http://www.MarketOracle.co.uk - The Market Oracle is a FREE Daily Financial Markets Analysis & Forecasting online publication.