


SPX Stock Market Downtrend Continues
Stock-Markets / Stock Markets 2016 Oct 29, 2016 - 12:59 PM GMTBy: Tony_Caldaro

 The market started the week at SPX 2141. After a gap up opening on Monday, and a SPX 2155 high, the market pulled back into Wednesday hitting 2132. Another gap up opening on Thursday took the market to SPX 2147. But another pullback dropped to the SPX to 2119 on Friday. For the week the SPX/DOW mixed, and the NDX/NAZ lost 0.95%. Economic reports for the week were again mixed. On the downtick: consumer confidence/sentiment, new home sales, durable goods, and the WLEI declined. On the uptick: Case-Shiller, FHFA housing, pending home sales, Q3 GDP, plus weekly jobless claims declined. Next week will be highlighted by the FOMC meeting, the ISMs and monthly Payrolls. Best to your week!
LONG TERM: uptrend
Some statistical analysis on the DOW. Since the year 1900 there have been 26 bear markets. Twenty of these bear markets have declined 20% or more. Probably the reason many generally accept a 20% decline as a bear market. Six bear markets declined less than 20%. The six that declined less than 20% bottomed in the following years: 1949, 1953, 1957, 1960, 1984 and 2016. After those lows the DOW performed as follows; 1949: +81% in 4 years, 1953: +104% in 4 years, 1957: +44% in 3 years, 1960: +30% in 1 year, and 1984: +155% in 3 years. The median DOW performance after each of the lows was +81% in 4 years.
Based on our proprietary/quantitative market analysis, since 1987 the FED has intervened in the equity futures markets seven times. The years of the interventions were: 1987, 1990, 1998, 2001, 2008, 2011 and 2016. They were successful in five of the seven times helping drive the stock market to new highs. After each of the interventions the DOW performed as follows; 1987: +87% in 3 years, 1990: +302% in 8 years, 1998: +59% in 2 years, 2001: dropped lower after intervention, 2008: dropped lower after intervention, 2011: +76% in 4 years. The median DOW performance after each of the successful intervention lows was +82% in 4 years. Some statistical information you may use or discard.
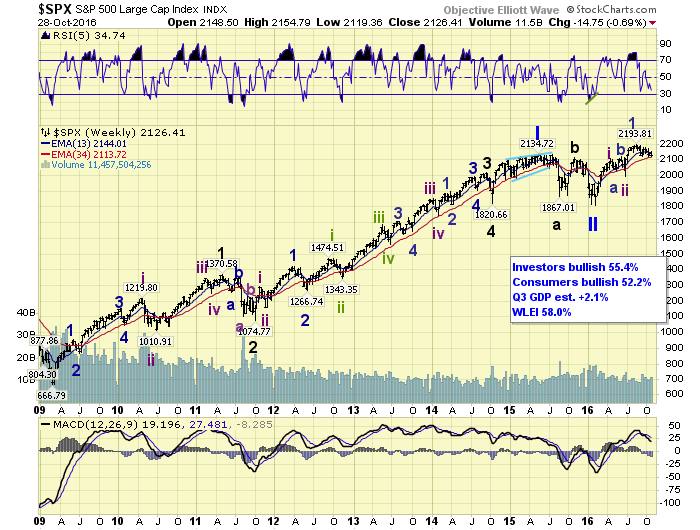
The long term count remains unchanged. The Primary I bull market, of Cycle wave [1], lasted between March 2009 and May 2015. A Primary II bear market followed into the February 2016 low. After that a Primary III bull market began. Thus far we have only observed three waves up in the SPX: 2011-1992-2194. We are counting these waves as Intermediate waves i and ii, followed by Minor waves 1 and 2. When the Minor wave 2 downtrend concludes, a Minor wave 3 uptrend to new highs should follow.
MEDIUM TERM: downtrend
The downtrend that began in mid-August at SPX 2194 continues. During the first decline to SPX 2119 in early-September it looked like it could have ended there. But the rallies that followed, despite gap up openings, were overlapping and choppy. Then in mid-October the SPX made a double low at 2115. But again, gap up openings with overlapping waves. On Friday the market returned to SPX 2119, and the 2116 pivot again held support as it has for two months.
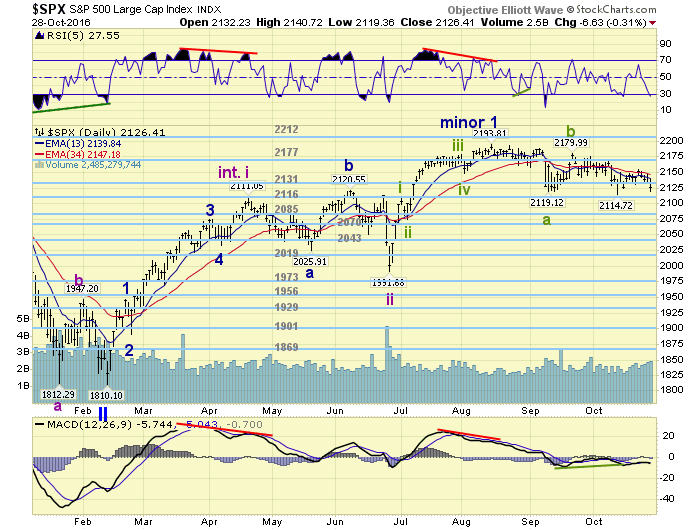
With all this choppy activity it still looks fairly clear that the correction is a complex a-b-c. Wave a @ SPX 2119, b @ SPX 2180, and c @ 2115/2119 thus far. We had considered a triangular fourth wave for a day or so. But this pattern would have to end above SPX 2111 to make the SPX 2194 high Int. wave iii. Looks like we’ll continue to track the complex a-b-c. When the correction does end the market should kick off into a third wave. Medium term support is at the 2116 and 2085 pivots, with resistance at the 2131 and 2177 pivots.
SHORT TERM
Another choppy week with overlapping waves. Every gap up opening has been sold. And every decline has been bought. The tug of war continues. No need to get into a description of the smaller waves, other that the a-b-c pattern, since it has been quite a choppy mess. Since it does appear this downtrend has yet to conclude we reviewed some potential support areas.
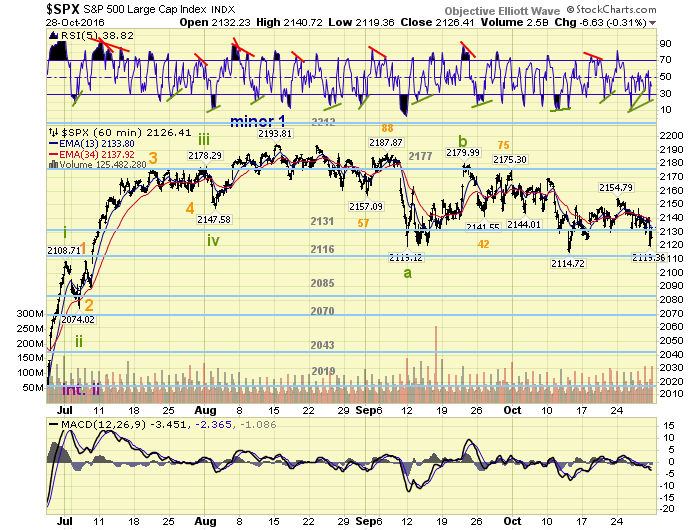
The 2116 pivot range represents a 38.2% retracement of the entire uptrend. A 50% retracement would occur just below the SPX 2100 level. Then a 61.8% retracement would drop the market down to around SPX 2070. The key level to watch is of course SPX 1992. Should the market drop that far then the entire advance from the February low would look like an a-b-c zigzag. This is what bear market rallies look like, not the beginning of bull markets. Support then is the 2116 pivot, SPX 2100 and SPX 2070.
FOREIGN MARKETS
Asian markets were mostly lower on the week for a net loss of 0.6%.
European markets were mostly higher but finished mixed.
The Commodity equity group also finished mixed.
The DJ World index lost 0.6%.
COMMODITIES
Bonds continue to downtrend and lost 0.6%.
Crude looks like it started a downtrend and lost 4.2%.
Gold remains in a downtrend but gained 0.7%.
The USD continues to uptrend but lost 0.4%.
NEXT WEEK
Monday: personal income/spending and the PCE at 8:30, then the Chicago PMI at 9:45. Tuesday: ISM, construction spending, and auto sales. Wednesday: the ADP and the FOMC statement. Thursday: weekly jobless claims, factory orders, and ISM services. Friday: monthly payrolls and the trade deficit. With the FBI stirring the Clinton-probe pot again, the FOMC meeting mid-week, and monthly payrolls end-week. This week could be quite volatile. Best to your weekend!
CHARTS: http://stockcharts.com/public/1269446/tenpp
After about 40 years of investing in the markets one learns that the markets are constantly changing, not only in price, but in what drives the markets. In the 1960s, the Nifty Fifty were the leaders of the stock market. In the 1970s, stock selection using Technical Analysis was important, as the market stayed with a trading range for the entire decade. In the 1980s, the market finally broke out of it doldrums, as the DOW broke through 1100 in 1982, and launched the greatest bull market on record.
Sharing is an important aspect of a life. Over 100 people have joined our group, from all walks of life, covering twenty three countries across the globe. It's been the most fun I have ever had in the market. Sharing uncommon knowledge, with investors. In hope of aiding them in finding their financial independence.
Copyright © 2016 Tony Caldaro - All Rights Reserved Disclaimer: The above is a matter of opinion provided for general information purposes only and is not intended as investment advice. Information and analysis above are derived from sources and utilising methods believed to be reliable, but we cannot accept responsibility for any losses you may incur as a result of this analysis. Individuals should consult with their personal financial advisors.
Tony Caldaro Archive |
© 2005-2022 http://www.MarketOracle.co.uk - The Market Oracle is a FREE Daily Financial Markets Analysis & Forecasting online publication.