


Stock Market and Election Implications
Stock-Markets / Stock Markets 2016 Nov 04, 2016 - 04:25 AM GMTBy: Brad_Gudgeon

 The SPX is attempting to rally this morning and we had those strange up blips up in the aftermarket yesterday on the SPY to 213.10, but earlier this week saw one that went to 215.53 and it did not work as it has in the past.
Ideally, we see a market top today 2 TD's. The last three 8 TD cycles ( 2) ran 6+6+10. We have another trine on Nov 5th, the last two (Oct 30 & Nov 1) knocked the market down after holding it up slightly on very strange internal e-wave patterns that normally suggest higher prices (the problem with interpreting bearish abc waves).
The moon is in Sagittarius and many lows are formed in Sagittarius especially around Capricorn turns (today). Scorpio sun sq's the moon in Aquarius Sunday through Tuesday and that usually means selling. We may have an irregular bottom forming next week around election, but a rally into November 15th looks to be the case and as high as the upper 2190's or low 2200's.
Bradley turns are helio-geo Nov 1-3 top (obviously inverted), helio-geo Nov 13-15 (bottom, inverted again it looks to be a top & full moon the 14th) and then helio-geo-geo-helio Nov 24, 25, 28, 29 (top but again inverted likely). The last one is a HUGE turn in many ways and may well represent the 10/20/40 week low (ideal low due Nov 28). Dec 1 is a trine as is Nov 26 so....
We had positive divergences forming later in the day yesterday and also today, so a relief bounce is expected perhaps on the jobs report (non-farm payrolls 11/4). Already, the fear index and P/C ratio are screaming fear and this kind of behavior is found near bottoms. The astros tell us more selling early next week though (election jitters?).
Speaking of the election, I thought that the stock market was supposed to rally if Hillary won??? But then we get a huge sell-off from the 15th down to the 28th??? Does that mean early on, people think Hillary won, but then she doesn't???
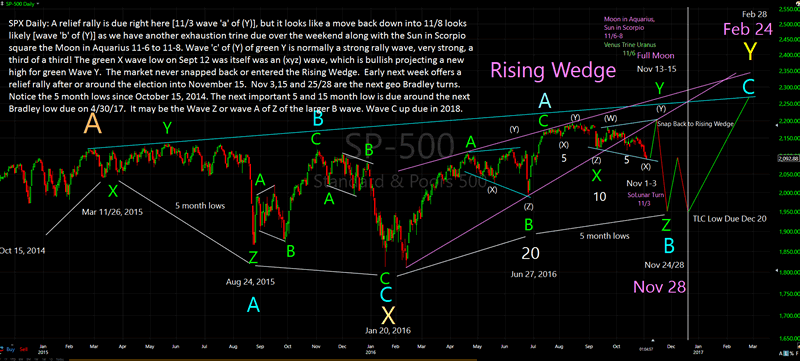
Overall, the bigger picture suggests Wave B of a larger Y (X arrived on Feb 11, 2016) wave due on or near Nov 28 (SPX 1950?) and again a double bottom on Dec 20 (per the TLC white line on the chart). If this chart is correct, we see much higher prices into the end of Feb 2017 out of the Dec 20 low.
Wave Z of B could be the big one everyone is expecting here in November and could occur as early as late April 2017 or as late as early October 2017 if Wave Z falls in ABC fashion. We could easily see the SPX down into the mid to upper 1600's depending on where it where Wave Z terminates. Out of Wave B comes the final Wave C rally into 2018 before the expected horrendous crash (worst since 1929-32). The market tends to run an approximate 88 year cycle, which is four 22-year generational cycles (Sept 1929 + 88 years = late 2017). The 88-year cycle is not perfect, but it is close.
Benner's Cycle along with McClellan's work on peak oil price (2008) +10 years pick market tops and that is 2018. The low expected is 2020/21 based on one Benner's Cycle last seen 2000/2003 and 1984-87 before that (Harry Dent agrees with 2020 for the low); after this coming bottom, 2037-40, which is near the 60/62 year K cycle top in gold due 2040-42 (post WWIII inflation?).
Last week I predicted GDX would hit 26.02 by Friday this week and then a pull back. Yesterday saw 25.93 and an engulfing cloud and today what appears to be a bearish harami. Gold seems to be going opposite the stock market right now so we are likely to see a relief rally Friday (or today into Friday) and a sell-off in gold.
This weekend and forward, I'll draw up larger charts looking at the bigger picture. Wow! These are crazy times!
SPX Rising Wedge Daily Chart
Brad Gudgeon
Editor of The BluStar Market Timer
The BluStar Market Timer was rated #1 in the world by Timer Trac in 2014, competing with over 1600 market timers. This occurred despite what the author considered a very difficult year for him. Brad Gudgeon, editor and author of the BluStar Market Timer, is a market veteran of over 30 years. The website is www.blustarmarkettimer.info To view the details more clearly, you may visit our free chart look at www.blustarcharts.weebly.com.
Copyright 2016, BluStar Market Timer. All rights reserved.
Disclaimer: The above information is not intended as investment advice. Market timers can and do make mistakes. The above analysis is believed to be reliable, but we cannot be responsible for losses should they occur as a result of using this information. This article is intended for educational purposes only. Past performance is never a guarantee of future performance.
Brad Gudgeon Archive |
© 2005-2022 http://www.MarketOracle.co.uk - The Market Oracle is a FREE Daily Financial Markets Analysis & Forecasting online publication.