


Thanks to Obamacare, US Government Debt Is Worse Than You Think
Interest-Rates / US Debt Nov 07, 2016 - 02:04 PM GMTBy: John_Mauldin

 You’re probably aware that the US budget deficit jumped to $590 billion for fiscal 2016. What you might not know is that US government debt rose by $1.4 trillion last fiscal year. That difference between the deficit and debt increases is a huge number.
What did we spend that additional $800 billion on?
My friends Dr. Lacy Hunt and Van Hoisington of Hoisington Asset Management can answer that question and more. Using current CBO projections and the trend in off-budget debt, Lacy and Van estimate that US government debt could grow by an additional $13 trillion in the next 10 years (by 2025). That would put total debt at $33 trillion and push to 150% debt-to-GDP.
Here’s the big problem: that’s the optimistic scenario. It assumes 2.5% to 3% growth and no recessions. As I have shown in a few of my own recent letters, the on-budget deficit would balloon to $1.3 trillion in a recession, easily pushing the increase in debt to $2 trillion per year. That total of $33 trillion of US government debt could be reached in the very early 2020s.
But wait, there’s more. In Thoughts from the Frontline, I’ve written about the significant increases in the cost of insurance premiums under the Affordable Care Act. The rising premiums aren’t figured into the CBO budget forecast.
Many of you might think that’s not a budget issue because individuals pay the premiums. But keep in mind, we are subsidizing, either partially or completely, 25 million people under the Affordable Care Act. And rising premiums for those people will indeed mean an increase in the deficit. Within a few years that could add $200 billion to the deficit unless we figure out how to control healthcare costs.
So what will rising government debt due to growth? That is when Lacy and Van roll out the big research guns, which I’ll let you absorb for yourself.
Hoisington Management Quarterly Review and Outlook, 3Q 2016
By Dr. Lacy Hunt and Van Hoisington
Deficit and Debt
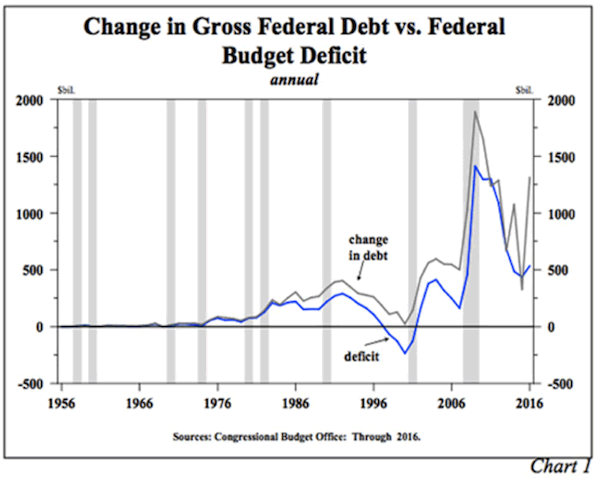
The Congressional Budget Office has estimated that in the fiscal year ending September 30, 2016, the U.S. budget deficit jumped to $590 billion, compared with $438 billion in the prior fiscal year. However, over the same time period the change in total gross federal debt surged upward by $1.4 trillion, more than twice the annual budget deficit measure.
This difference between the increase in the deficit and debt is not a one-off fiscal policy event but instead part of an historical pattern. From 1956 until the mid-1980s, the change in gross federal debt was always very close to the deficit (Chart 1). However, over the past thirty years the change in debt has exceeded the deficit in 27 of those years, which served to conceal the degree to which the federal fiscal situation has actually deteriorated. The extremely large deviation between the deficit and debt in 2016 illustrates the complex nature of the government accounting.
To better understand why there is a gap between the increase in the deficit with the change in gross federal debt, we examine a recently available breakdown and analysis of data on the federal budget deficit from Louis Crandall of Wrightson ICAP, which consists of the year- over-year change ending June 30, 2016. The increase in debt for that period was over $1.2 trillion while the deficit was $524 billion, a near $700 billion difference. The discrepancy between these two can be broken down as follows (Table 1): (a) $109 billion (line 2) was due to the change in the treasury cash balance, a common and well understood variable item; (b) $270 billion (line 3) reflects various accounting gimmicks used in fiscal 2015 to limit the size of debt in order to postpone hitting the Debt Limit. Thus, debt was artificially suppressed relative to the deficit in 2015, and the $270 billion in line 3 is merely a reversal of those transactions, a one-off, non-recurring event; (c) $93 billion (line 4) was borrowed by the treasury to make student loans, and this is where it gets interesting. Student loans are considered an investment and therefore are not included in the deficit calculation. Nevertheless, money has to be borrowed to fund the loans, and total debt rises; (d) In the same vein, $70 billion (line 5) was money borrowed by the treasury to increase spending on highways and mass transit. It is not included in the deficit calculation even though the debt increases; (e) $75 billion (line 6) was borrowed because payments to Social Security, Medicare and Affordable Care Act recipients along with the government’s civilian and military retirees were greater during this time frame than the FICA and other tax collections, a demographic development destined to get worse; (f) Finally, the residual $82 billion (line 9) is made up of various unidentifiable expenditures including “funny money securities stuffed in various trust funds”.
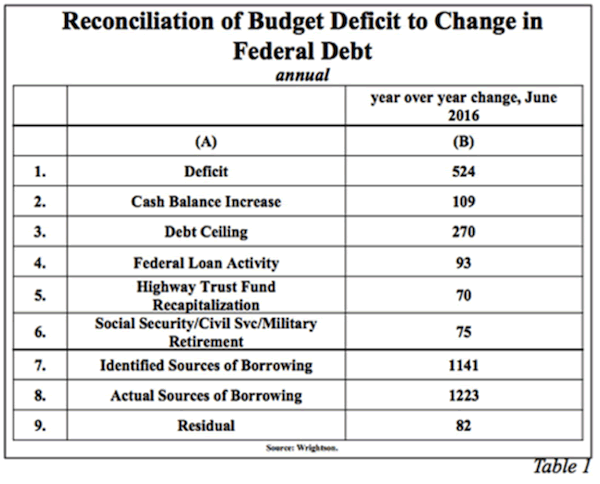
As noted, these last four items discussed above (lines 4, 5, 6 and 9), which total $320 billion, fund activities and raise debt, but they are not in the deficit. Instead they are categorized as something else. Under the principles of economics, they are in fact cash expenditures that raise federal debt.
The future does not look any better. In January 2015, the nonpartisan Congressional Budget Office (CBO) said that the cumulative ten- year U.S. budget deficit (2015 to 2025) would total $8.1 trillion. In their August 2016 projection, the CBO places the current ten-year deficit at a much higher $9.2 trillion. If history is any indicator, the actual increase in debt is likely to be much greater than $9.2 trillion. In the past ten years, the cumulative budget deficit was “only” $7.9 trillion, but the increase in debt was $10.9 trillion, a 38% difference. Using the same math, by 2025 the debt increase will be in the neighborhood of $13 trillion, based on the $9.2 trillion deficit increase projected by the CBO. Additionally, the CBO’s economic projections rely on acceleration in economic growth from the pace thus far in this expansion, without adequate support for their forecast.
A Global Trend
The deteriorating U.S. fiscal situation is duplicated in Europe, the United Kingdom, Australia, Canada, Japan and China. Moreover, calls for more “fiscal stimulus” in the U.S., the EU and Japan have increased. In The Wall Street Journal article “Let’s Get Fiscal” published August 10, 2016, well-respected journalist and economics editor Mike Bird wrote, “After years of austerity, governments in the developed world are becoming more relaxed about loosening their purse-strings and engaging in a bit of fiscal stimulus.” And in an article entitled “Monetary Policy in a Low R-star World”, John C. Williams, President of the Federal Reserve Bank of San Francisco, published in the bank’s Economic Letter of August 15, 2016 wrote “... fiscal and other policies must also take on some of the burden to help sustain economic growth.”
The exceedingly ironic aspect is that such prominent figures think government spending has been constrained. According to the latest tabulations from the Organization for Economic Cooperation and Development (OECD), government debt-to-GDP ratios are at record highs in the U.S., the EU, the UK, Japan and a large number of other countries. No austerity has occurred, and consequently, even higher debt-to- GDP ratios will continue to be the norm in the ensuing years.
Counterproductive Fiscal Actions
If new fiscal measures are enacted, debt- to-GDP ratios will be increased and will further depress growth, thereby causing interest rates to move lower, not higher. In a highly incongruous development, governments will therefore be able to finance their new debt offerings at lower costs. While this may seem to be a good thing for the individual governments, the great majority of their constituents will be harmed. The higher debt will set off a chain reaction of unintended consequences. The 70-75% of the households
that receive the bulk of their investment income from interest bearing accounts will have fewer funds for retirement. This, in turn, will cause older members of the workforce to work longer and save more, blocking job opportunities for new entrants into the labor force. Thus, fiscal decisions, which result in higher deficits, are likely to perpetuate and intensify our underlying economic problems.
Textbooks Versus Reality
Textbooks have historically hypothesized that government expenditures lift economic growth by some multiple of every dollar spent through a positive government expenditure multiplier. As such, deficit spending has long been considered to be a positive for economic expansion. If the expansion lasts long and generates faster actual and expected inflation, bond yields should rise via Irving Fisher’s equation (Theory of Interest, 1930).
Impressive scholarly research has demonstrated that the government spending multiplier is in fact negative, meaning that a dollar of deficit spending slows economic output. The fundamental rationale is that the government has to withdraw funds, via taxes or borrowing, from the private sector, to spend their dollars. When that happens, the more productive private sector of the economy has fewer funds to use to make productive investments. Thus the economy slows along with productivity when government spending increases. Further, studies show that government debt-to-GDP as low as 50% can begin to have a negative impact on growth. More substantial deleterious consequences are seen when government debt-to-GDP reaches the 70%- 90% range, and the negative effects become non- linear above that level. As an economy becomes more over-indebted, additional government spending slows growth even more due to “non- interest economic costs” such as misallocation of saving, reduced productive investment, weaker productivity growth and eventually a deterioration in demographics. Slower growth will cause underutilized resources to build, bringing down inflation and subsequently interest rates. Therefore, increasing deficits have, and will continue to result in lower, not higher, interest rates.
The Government Expenditure Multiplier
Just completed scholarly studies strengthen our conviction that deficit spending and elevated government debt levels are a force for weaker economic activity. Although the statistical evidence against the positivie government spending, or Keynesian, multiplier has been overwhelming for a long time, the possibility did exist that these estimates were picking up a reverse correlation or a feedback bias due to the possibility that government spending increased in a recession causing a positive correlation to the business cycle. In technical terms this is called the endogeneity bias, a point strongly rejected by this latest research. William Dupor and Rodrigo Guerrero (“Government Spending Might Not Create Jobs, Even in Recessions”, The Regional Economist, July 2016) tackled this issue very creatively. They were able to use data developed by Michael T. Owyang, Valerie Ramey and Sarah Zubairy (“Government Spending Multipliers in Good Times and in Bad: Evidence from U.S. Historical Data”, Working Paper, 2016).
Dupor and Guerrero, of the Federal Reserve Bank of St. Louis, examined the efficacy of government spending at increasing employment in relation to over 120 years of U.S. military spending. Defense spending has the advantage of eliminating feedback loops because it is likely to be determined primarily by international geopolitical factors rather than the nation's business cycle.
To control for potential “anticipation effects”, Owyang, Ramey and Zubairy used historical documents to construct a time series of military spending news shocks. Economics professors Ramey and Zubairy (University of California-San Diego) and Owyang (Texas A&M), were thus able to disentangle the time of military spending from when the public learned that military spending was going to change in the future. The output response to the spending shocks was minimal and the outcome did not depend on whether the economy was slack. Employing a similar methodology, Dupor and Guerrero found that military spending shocks had a small impact on civilian employment. Following a policy change that began when the unemployment rate was high, if military spending increased by one percent of GDP, then total employment increased by between zero percent and 0.15 percent. Following a policy change that began when the unemployment rate was low, the effect on employment was even smaller. As such, countercyclical government spending may not be very effective, even when the economy has substantial slack.
Other rigorous new research by Alberto Alesina, Carlo Favero and Francesco Giavazzi corroborates that the tax and government expenditure multipliers are both negative, with the tax multiplier more negative. A negative tax multiplier means that a dollar decrease in the marginal tax rate will result in higher GDP growth and vice versa. These conclusions are supported by domestic as well as international data. The study entitled, “The output effect of fiscal consolidation plans”, is forthcoming in the peer reviewed Journal of International Economics, but the working paper is available on the internet. Alesina is a Professor at Harvard while Favero and Giavazzi are professors at IGIER-Bocconi.
Decelerating Economic Growth
From a fiscal and Keynesian perspective, 2016 should have been a year of accelerating economic activity. There was no crisis in passing the 2016 budget. There was a nonpartisan deal to accelerate military and civilian spending as well as a deal to hike outlays for highways. The increased expenditures and debt were going to occur after two years of slower growth in nominal GDP, which according to its advocates meant that the timing was right. Nevertheless, the economy sputtered (Table 2). This once again confirms the existence of a negative government spending multiplier.
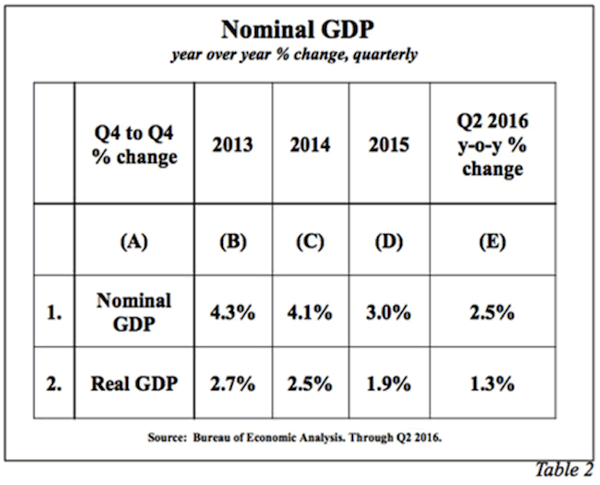
The outward evidence indicates that this “stimulus” was, at best, extremely fleeting, if it was beneficial at all, since the economy’s real growth rate is on track to slow significantly in 2016 versus 2015. A $1.4 trillion jump in federal debt was paired with both weaker economic growth and falling treasury yields.
Unfortunately, the 2017 economic horizon is clouded by the rising likelihood of further increases in government spending and debt. The inevitable result will be slower economic growth and declining interest rates, a pattern similar to the 2016 experience.
FREE Report: How the High Priests of Economics Are Leading Us to Monetary Hell
Contrary to common belief, it’s not greedy Wall Street brokers that are wrecking the US economy—but academic policymakers like the ones employed by the Federal Reserve. And they all have the best intentions… Read financial-bestseller author John Mauldin’s riveting special report, How the High Priests of Economics Are Leading Us to Monetary Hell. Click here to get your free copy now. John Mauldin Archive |
© 2005-2022 http://www.MarketOracle.co.uk - The Market Oracle is a FREE Daily Financial Markets Analysis & Forecasting online publication.