


The US Presidential Election Stock Market Cycle
Stock-Markets / Stock Markets 2016 Nov 07, 2016 - 06:23 PM GMTBy: Gary_Tanashian

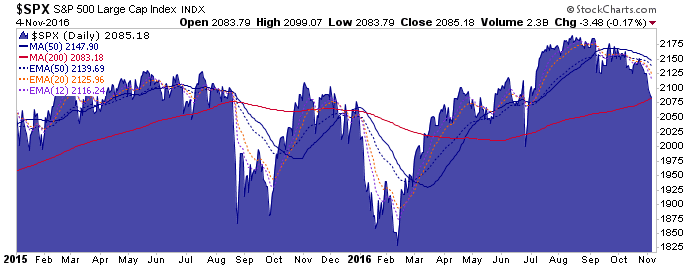
 The market has been very readable since before Brexit. It was over bearish and due for a post-Brexit rally
 ![]() . It was due for a drop to test major support
. It was due for a drop to test major support ![]() , but amid last week’s highly broadcast 9 straight down days and the renewed Clinton email scare, it was due for a bounce from over bearish status
, but amid last week’s highly broadcast 9 straight down days and the renewed Clinton email scare, it was due for a bounce from over bearish status ![]() . However, this is not the end of the story. We remain on a test of major support unless certain upside resistance parameters are taken out. Beyond this highly volatile phase, we are likely either going to confirm major support and potentially break out to new highs or a bear market will ensue.
. However, this is not the end of the story. We remain on a test of major support unless certain upside resistance parameters are taken out. Beyond this highly volatile phase, we are likely either going to confirm major support and potentially break out to new highs or a bear market will ensue.
Figuring prominently in the short-term is the US election. Here is NFTRH 420’s weigh-in on something I almost never want to comment on but did in this week’s report, given Donald Trump’s ‘overbought’ status last week.
The Presidential Cycle (graphic sources: FactSet.com)
The final 2 months of previous election years have been overwhelmingly positive. The exceptions being the tumultuous times of the Great Depression leading into World War II and very interestingly, the recessionary times of 2000 and 2008.
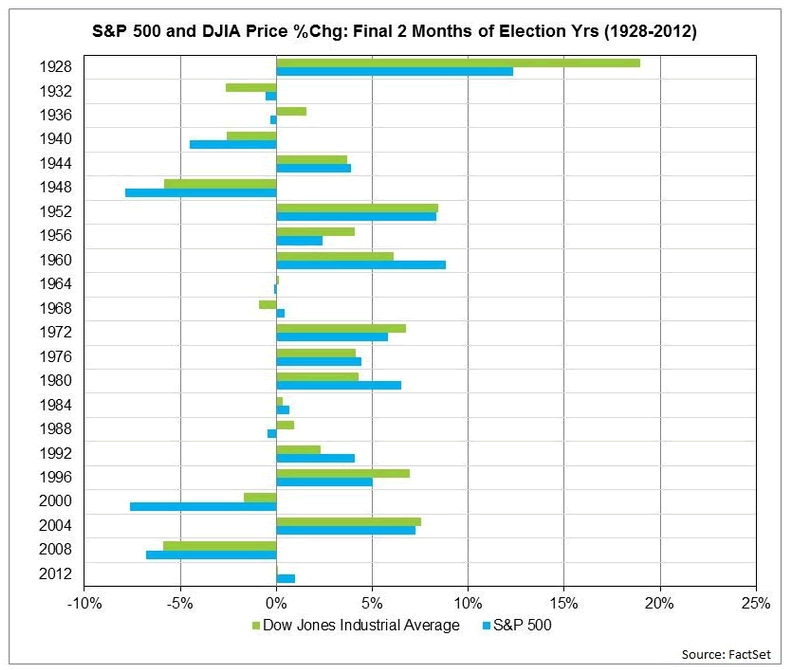
2000 and 2008 are relevant to today because these were also election cycles that have come during what I have called the “age of Inflation onDemand”; i.e. they have come during the post-2000 phase first kicked off by Alan Greenspan, continued by Ben Bernanke and now… Janet Yellen, which features ever more intrusive and innovative inflationary monetary policies in response to market and economic problems. In other words, we are in a time of boom and bust cycles, at least when one party hands off its 8 years in office to another.
The two cases from this millennium were Democrat on Republican crime and Republican on Democrat crime. In other words, the implication of that small sample size is that if Trump wins, the market would turn today’s weakness into a support breakdown and some terribly bearish events. If Clinton wins, the situation is more hazy, but with party continuity – as in 1996, 2004 and 2012 – the implication would lean bullish.
Now, I am not saying these would be the effects that actually come about. I am saying that the data indicate that way. But in market management we have to use many tools at once in finding our path. There are no absolutes and there are no silver bullets. When someone promotes a single indicator that “predicted” an event they are leaving out all the times it failed to predict events (when used on its own).
So going by the above data, a Trump victory would be the market-bearish course. A Clinton victory would probably see major support hold in US markets. Or would it? A breakdown of nearly a century’s worth of data shows that the market finishes out election years better under an elected Republican than Democrat.
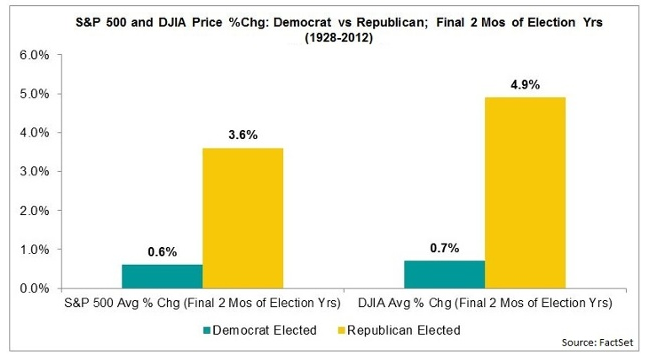
But then, the entire year has tended to be positive when a Republican is to be elected.
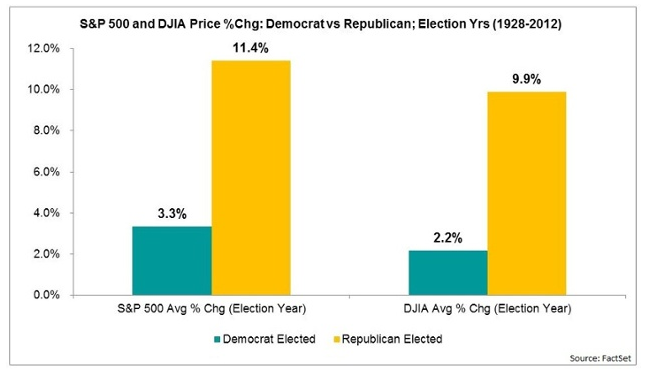
These data points are blunt and take out the details we worked through above, and I am inclined to give more weight to dynamics in play most recently, like 8 year presidential runs handed off to the other party during the “age of inflation onDemand”, AKA a time of boom and bust cycles of increasing intensity. So if one party hands off to the other, especially with the questions and controversy surrounding Trump, the implication is bearish, if taken at face value.
Keeping the tool blunt, we generically review the 4 years of the cycle, without the details. What I find interesting is that on this cycle ‘Election Year +3’ was relatively bearish (ref. the market disturbances and what sure did look like a topping pattern in 2015). Speaking as a data twittler, I might not read much into that. But speaking as a human with perhaps paranoid intuition, I do not feel good about that. What I feel is that in maintaining easy monetary policy long past its shelf life, the Federal Reserve may have built in the next moral hazard by denying that massive S&P 500 topping pattern its due pound of flesh.
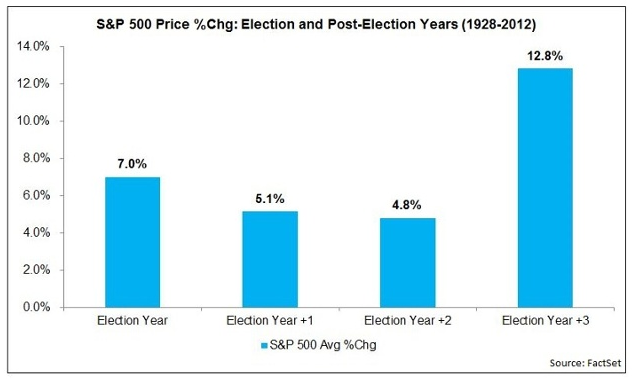
Here is what I mean. For all that policy leniency, this is all they could muster in years 3 & 4? A basically flat market in 2015 and essentially the same thing in 2016?
If I wanted to go all Tin Foil Hat on you I’d say that they have been propping and propping, and yet greatly underperformed the historical despite such efforts. Now what happens if we hand off to a new party? For that matter, what happens when we hand off to a new president, regardless of party?
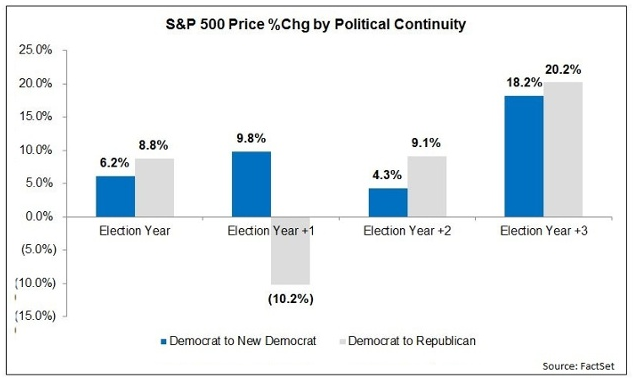
Here is a breakdown of Democrat to Democrat and Democrat to Republican hand offs. Election year seems fine (again, if we ignore 2000 and 2008, which we of course won’t). But what is up with Demo to Repub in Year 1? This generalized data has an anomaly that is well worth our attention.
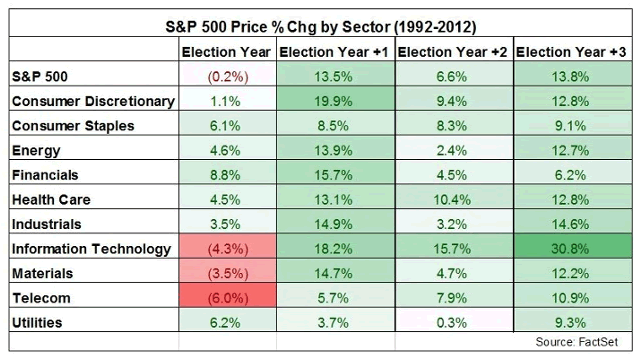
Finally, a look at sector performance during elections years. This view shortens the sample size from early last century to 1992 (when S&P sector data first became available). Use the sector data as you will, but what I find more interesting is that since 1992 the S&P 500 as a whole has been negative during election years (driven by Info Tech, Materials and Telecom).
Bottom Line
I see enough in the various data above to be very guarded through the election if Trump holds firm or gains in the polls. There is a scenario where the final 2 months could be okay but then 2017 hits the skids and there are multiple other scenarios in play. The theme for me personally and for NFTRH, has been profit retention since mid-summer. With so many wild cards in play I think we should continue on that path this week. The main items that jump out at me are the more recent examples of Demo → Repub in 2000 and Repub → Demo in 2008, (which preceded bear markets and recessions), the fact that Year +3 was incredibly weak and extreme weakness of EY +1 (2017) when a Democrat hands off to a Republican. The market wants Clinton, i.e. status quo.
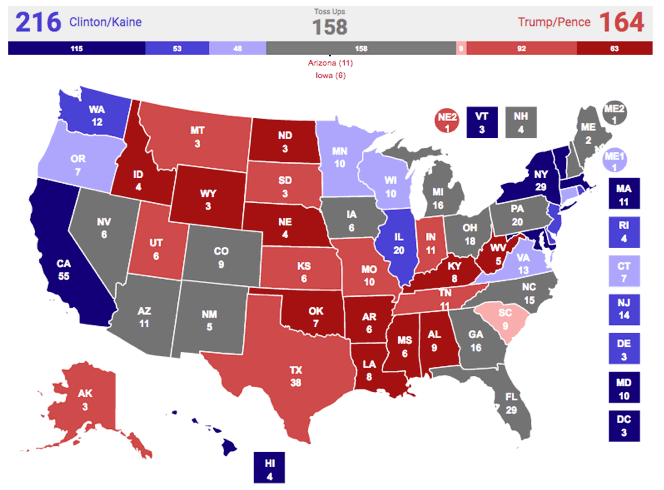
And on that note we finish with a look the most recent polling and electoral map from RealClearPolitics.com. If the most recent Clinton email scare did not put Trump even or ahead, the odds favor Mrs. Status Quo. To put it in a way familiar to our usual discussions, I think Trump got short-term over bought last week. And with the election on Tuesday, the short-term is all there is. [edit: on this last note, this just out: Clinton Gets Boost From FBI]
![]()
Subscribe to NFTRH Premium for your 25-35 page weekly report, interim updates (including Key ETF charts) and NFTRH+ chart and trade ideas or the free eLetter for an introduction to our work. Or simply keep up to date with plenty of public content at NFTRH.com and Biiwii.com.
By Gary Tanashian
© 2016 Copyright Gary Tanashian - All Rights Reserved
Disclaimer: The above is a matter of opinion provided for general information purposes only and is not intended as investment advice. Information and analysis above are derived from sources and utilising methods believed to be reliable, but we cannot accept responsibility for any losses you may incur as a result of this analysis. Individuals should consult with their personal financial advisors.
Gary Tanashian Archive |
© 2005-2022 http://www.MarketOracle.co.uk - The Market Oracle is a FREE Daily Financial Markets Analysis & Forecasting online publication.