Crude Oil Unable to Follow Through to the Upside
Commodities / Crude Oil Aug 01, 2008 - 12:33 PM GMTBy: Mike_Paulenoff
Fits of volatility can come from 1) energy...2) financials...3) Gov't data... 4) geopolitics... take your pick, but just hope that we are not positioned opposite of the directional spike! Let's have a look at crude oil...
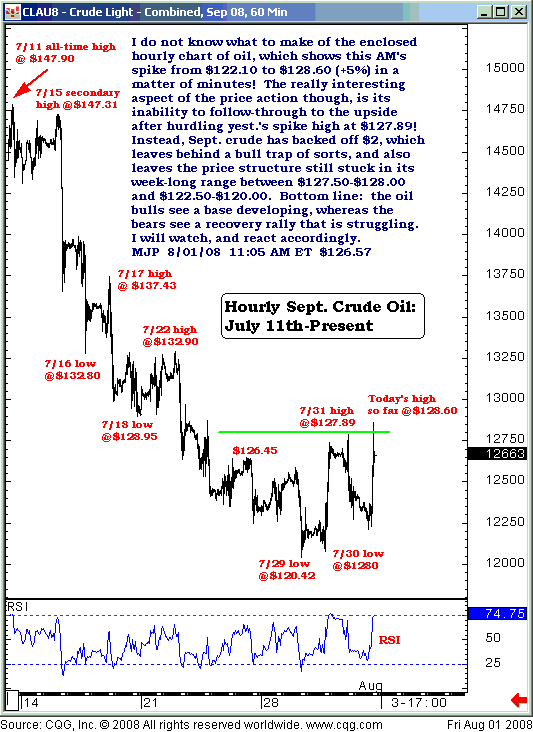
I do not know what to make of the enclosed hourly chart of oil, which shows this morning's spike from $122.10 to $128.60 (+5%) in a matter of minutes! The really interesting aspect of the price action, through, is its inability to follow through to the upside after hurdling yesterday's spike high at $127.89.

Instead, Sept crude has backed of $2, which leaves behind a bull trap of sorts and also leaves the price structure still stuck in its week-long range between $127.50-$128.00 and $122.50-$120.00. Bottom line: the oil bulls see a base developing, whereas the bears see a recovery rally that is struggling. I will watch, and react accordingly via the US Oil Trust (AMEX: USO) ETF.
Sign up for a free 15-day trial to Mike's ETF Trading Diary today.
By Mike Paulenoff
Mike Paulenoff is author of the MPTrader.com (www.mptrader.com) , a real-time diary of Mike Paulenoff's trading ideas and technical chart analysis of Exchange Traded Funds (ETFs) that track equity indices, metals, energy commodities, currencies, Treasuries, and other markets. It is for traders with a 3-30 day time horizon, who use the service for guidance on both specific trades as well as general market direction
© 2002-2008 MPTrader.com, an AdviceTrade publication. All rights reserved. Any publication, distribution, retransmission or reproduction of information or data contained on this Web site without written consent from MPTrader is prohibited. See our disclaimer.
Mike Paulenoff Archive |
© 2005-2022 http://www.MarketOracle.co.uk - The Market Oracle is a FREE Daily Financial Markets Analysis & Forecasting online publication.


