


US Stocks Bull Market New All Time Highs
Stock-Markets / Stock Markets 2016 Nov 26, 2016 - 06:54 PM GMTBy: Tony_Caldaro

 The market started the week at SPX 2182. After a gap up opening Monday the market rallied to SPX 2205 by Tuesday. Then after a pullback to SPX 2195 on Wednesday the market closed out the week at a new closing high of SPX 2213. For the week the SPX/DOW gained 1.45%, and the NDX/NAZ gained 1.40%. Economic reports were mostly positive. On the downtick: weekly jobless claims and the trade deficit both increased. On the uptick: existing home sales, durable goods, the FHFA, consumer sentiment and the WLEI. Next week’s reports will be highlighted by Q3 GDP, monthly payrolls, the PCE and the FED’s beige book. Best to your week!
LONG TERM: uptrend
Nine months into this new bull market, and 2+ weeks after the presidential election some interesting and noteworthy events have occurred. As with all new bull markets there has been a change in leadership. Sectors that outperformed during the 2009-2015 bull market, i.e. health care, consumer discretionary and consumer staples, are underperforming the financials, materials and energy sectors. The old leaders were XLP, XLV and XLY, and the new leaders are XLB, XLE and XLF.
We are also witnessing what often occurs in the beginning of bull markets and in third wave thrusts: small capitalization leadership. Since the February low the Semiconductors and Russell 2000 have significantly outperformed all the major indices except the Transports. The R2K has been rising for 15 days in a row, and hit an overbought condition that has not occurred since the 1990’s. One has to go back to 1999 to find the last time the R2K had a daily RSI of 96+. In fact, during the 1990’s the R2K hit an overbought reading of 96+ six times and none since, until this week.
Naturally bull markets do not unfold without the proverbial wall of worry. And this market has already had its share of crisis events. The commodity melt down in January/February which ended the bear market, the Br-exit vote in June, and the Trump vote in November. Then there is the ongoing concerns of a high Debt/GDP ratio, the rising USD, an historically high PE multiple, a new administration just ahead, and now rising long term rates. Bull markets do not unfold without the proverbial wall of worry.
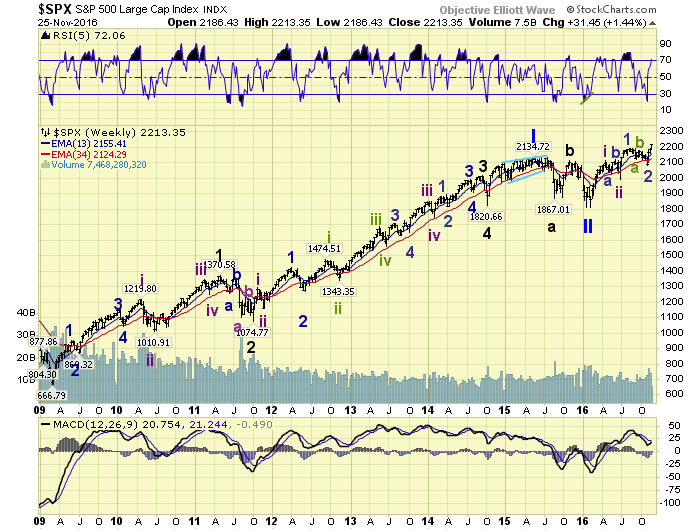
Our long term count remains unchanged. A Super cycle low in March 2009, led to a Primary I bull market until May 2015. Then after a short Primary II bear market into February 2016, a Primary III bull market was underway. Thus far we have counted only three impulse uptrends from that SPX 1810 low. Intermediate waves i and ii in April and June, then Minor waves 1 and 2 in August and November. Minor wave 3 is currently underway and has already made new all time highs.
MEDIUM TERM: uptrend
The characteristics of this new bull market have been quite simple thus far. Both impulse uptrends have lasted two months, and both corrections that followed have lasted 2 – 3 months. This suggests this new uptrend should at least last from November to January. Also the first uptrend was about 300 SPX points, and the second of a lesser degree was about 200 points. This relationship suggests the current uptrend should rise about 300 SPX points, to around the SPX 2380’s. Three weeks into the uptrend and the market has already reached SPX 2213.
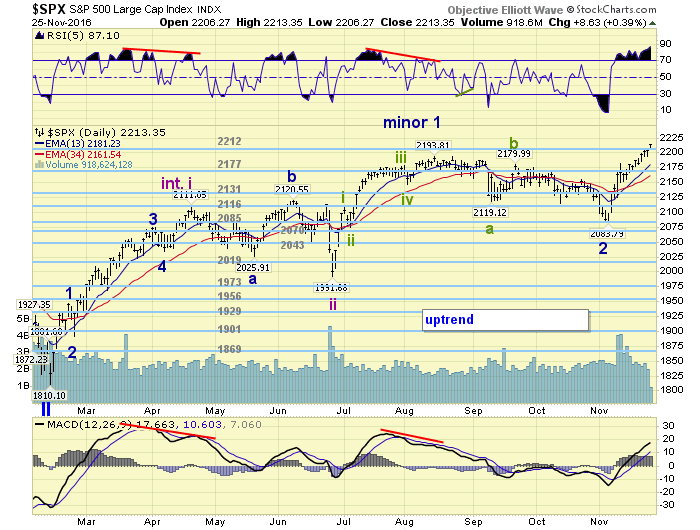
The uptrend, thus far, still appears to be in its first of five waves up. The first wave up of the previous two impulse uptrends were 137 points and 117 points. This first wave has already risen 129 points, which fits right in the middle. At SPX 2222, oddly enough, it will be longer than the previous two first waves. At Friday’s close the daily RSI is now the most overbought it has been since the bull market began in February, and the most overbought it has been since November 2014. Seems this market is due for that second wave pullback sooner than later. Medium term support is now at the 2212 and 2177 pivots, with resistance at the 2270 pivot.
SHORT TERM
The advance from the SPX 2084 downtrend low to Friday’s SPX 2213 uptrend high has been a bit difficult to count. Just when the market looks like it’s ready for a significant pullback, the dips are bought and the rally extends. We initially started counting the waves from the absolute low at SPX 2084, shifted to the secondary low at 2085, and now are back to the absolute low again. Thus far we can count 27 small waves from that low, obviously making it difficult to track.
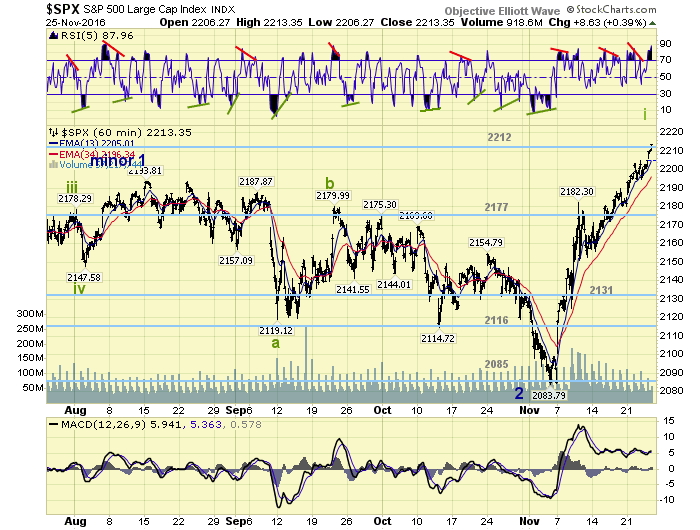
The only significant pullback that has occurred since the SPX 2084 low, occurred within one hour’s time on November 10th when the SPX dropped from 2182-2151. There were two other pullbacks of 20+ points, one before and one after the 10th. Other than that the pullbacks have been generally quite small. Rather than put some labels on all these waves we will just wait until the market provides a meaningful pullback to signal the second of five waves. Currently this would require a drop into the 2177 pivot range again, from current or higher levels. Other than that the uptrend continues, with the SPX 2380’s as the upside target. Short term support is at the 2177 and 2131 pivots, with resistance at the 2270 pivot. Short term momentum ended the week extremely overbought. The most overbought since the uptrend began. Best to your trading!
FOREIGN MARKETS
Asian markets were all higher and gained 1.6%.
European markets were mostly higher and gained 0.7%.
The DJ World index rose 1.3%.
COMMODITIES
Bonds continue to downtrend and lost 0.2% on the week.
Crude is trying to uptrend but lost 0.7%.
Gold continues to downtrend and lost 2.5%.
The USD remains in an uptrend and gained 0.3%
NEXT WEEK
Tuesday: Q3 GDP (est. +2.9%), Case-Shiller and consumer confidence. Wednesday: the ADP, personal income/spending, the PCE, the Chicago PMI, pending home sales and the FED’s beige book. Thursday: weekly jobless claims, construction spending, ISM manufacturing, and auto sales. Friday: monthly payrolls (est. 172K) and the unemployment rate.
CHARTS: http://stockcharts.com/public/1269446/tenpp
After about 40 years of investing in the markets one learns that the markets are constantly changing, not only in price, but in what drives the markets. In the 1960s, the Nifty Fifty were the leaders of the stock market. In the 1970s, stock selection using Technical Analysis was important, as the market stayed with a trading range for the entire decade. In the 1980s, the market finally broke out of it doldrums, as the DOW broke through 1100 in 1982, and launched the greatest bull market on record.
Sharing is an important aspect of a life. Over 100 people have joined our group, from all walks of life, covering twenty three countries across the globe. It's been the most fun I have ever had in the market. Sharing uncommon knowledge, with investors. In hope of aiding them in finding their financial independence.
Copyright © 2016 Tony Caldaro - All Rights Reserved Disclaimer: The above is a matter of opinion provided for general information purposes only and is not intended as investment advice. Information and analysis above are derived from sources and utilising methods believed to be reliable, but we cannot accept responsibility for any losses you may incur as a result of this analysis. Individuals should consult with their personal financial advisors.
Tony Caldaro Archive |
© 2005-2022 http://www.MarketOracle.co.uk - The Market Oracle is a FREE Daily Financial Markets Analysis & Forecasting online publication.