


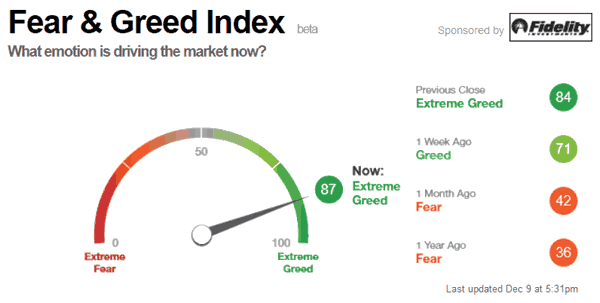
Stock Market Extreme Greed Reading
Stock-Markets / Stock Markets 2016 Dec 12, 2016 - 12:35 AM GMTBy: Andre_Gratian

 Current Position of the Market
SPX Long-term trend: If the market strength persists, the long-term trend may need to be re-evaluated.
SPX Intermediate trend: SPX intermediate count to 2240 may turn out to only be a minimum projection. This will be determined by market action over the next couple of weeks.
Analysis of the short-term trend is done on a daily-basis with the help of hourly charts. It is an important adjunct to the analysis of daily and weekly charts which discuss longer market trends.
EXTREME GREED READING
Market Overview
The short-term correction ended last Monday morning when the market opened with an upside gap and, after a minor consolidation, took off to the upside. The uptrend lasted practically until the very last tick on Friday. To say that the market is short-term overbought would be an understatement but, according to the Fear & Greed index, the market is also currently in a state of extreme greed. Combine this with the chart below, and you have a strong caution signal that we are very close to an intermediate top.
This is reinforced by projections to only slightly higher levels which could end the uptrend from 1810. I had stated earlier that a base at that level gave SPX a minimum target of 2240, but this was eclipsed by this week's strong advance. Other potential projections of interest for this advance are 2270, 2290 -2300.
In last week's letter, I mentioned two opposite points of view about the market's future potential. It will take a while to assess which of the two is correct. For now, the long-term bulls are apparently firmly in control.
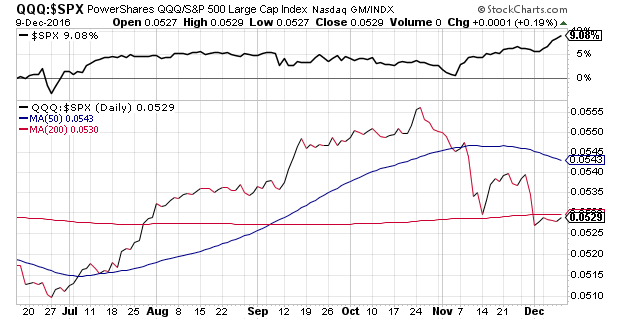
The relative value of QQQ to SPX (above, courtesy of StockCharts.com) did not improve in the past week. Considering that SPX's strong showing was not reflected in the performance of QQQ, we would have to say that the relative strength of the latter did not improve. This is what the chart shows.
Analysis
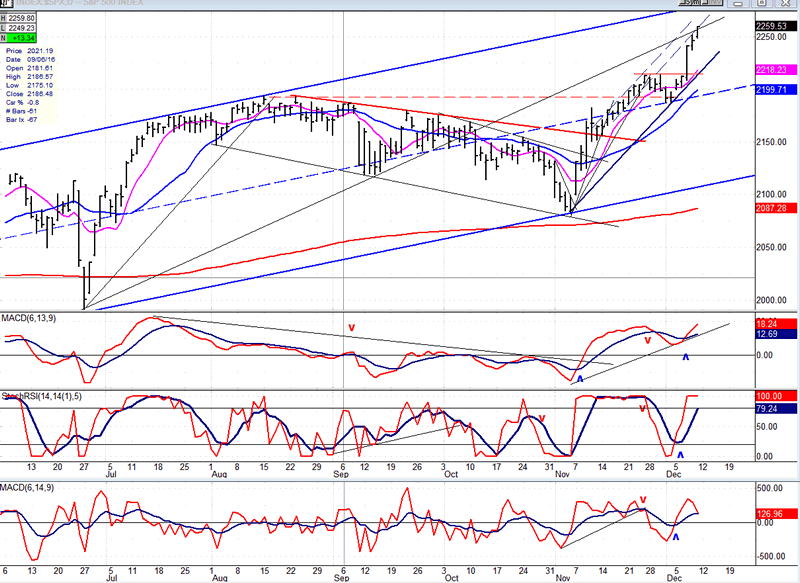
Daily chart
The SPX concluded about three months of corrective action across the wider blue channel and, from 2084, started an uptrend which reluctantly broke above the previous high before a pull-back which was caused by the 6-wk cycle. It then started up again and exploded upward as soon as it made a new high, by-passing several phase projections which could/should have initiated minor consolidation phases. The momentum carried into Friday with the index closing at the high of the move as it approached targets generated at the 1810 low. Since 2084, the index has been trading in a smaller channel, but it is meeting with some resistance that should prevent it from reaching the top of both the smaller and larger channels. Considering the warning issued by the sentiment index, if the move is confined to near-by projection levels, it should not be too long before the lower lines of both channels are challenged.
There was some peculiar market action which took place on November 9th. When Donald Trump overtook Hillary Clinton's lead in the delegate count, the SPX futures sold off more than one hundred points; but by the opening bell they had mostly recovered, so that none of this shows on the cash chart.
The momentum oscillators are in an uptrend, but the A/D has been trending down for the past two days against a strong price move. This is negative divergence in market breadth at the daily level -- another warning that a top is in the offing.
This chart and others below, are courtesy of QCharts.com.
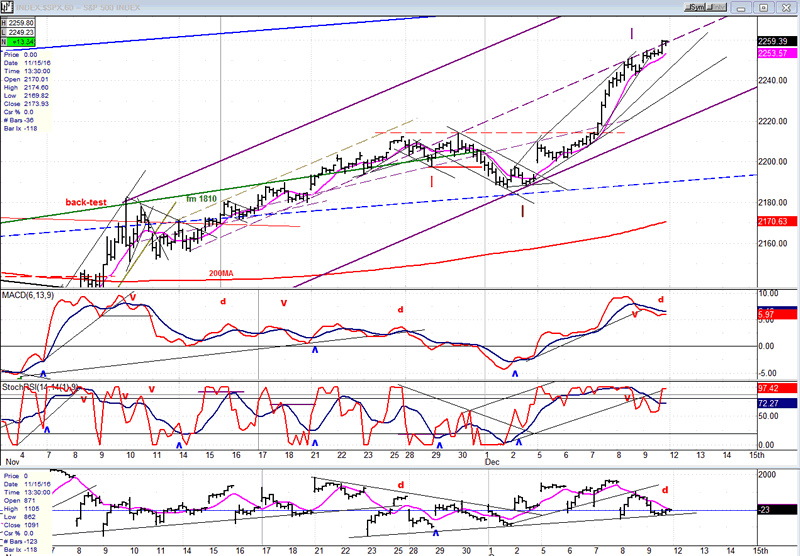
Hourly chart
After finding some resistance at the mid-channel line of the larger channel, SPX broke through, briefly pulled back to it, then accelerated its uptrend. It is now finding resistance at the mid-channel line of the smaller channel and, although it may rise above it to meet the projection targets discussed above, it is not likely to continue all the way to the channel top.
The small vertical purple line indicates when a minor cycle top should (and did) arrive. But it had no downward traction to speak of and prices were immediately swept higher by the lift coming from larger cycles and higher projections. However, there is another minor cycle low due on Thursday which comes just after the day when the Fed is expected to raise interest rates which should cause a minor pull-back.
The MACD has turned down and is showing negative divergence against still climbing prices. The SRSI could not maintain its downtrend and returned to the top of its range, but the next time it turns down, it should be accompanied by declining prices. The A/D indicator was negative for most of the day, but could not break through is support line. It's probably only a matter of hours before it does it.
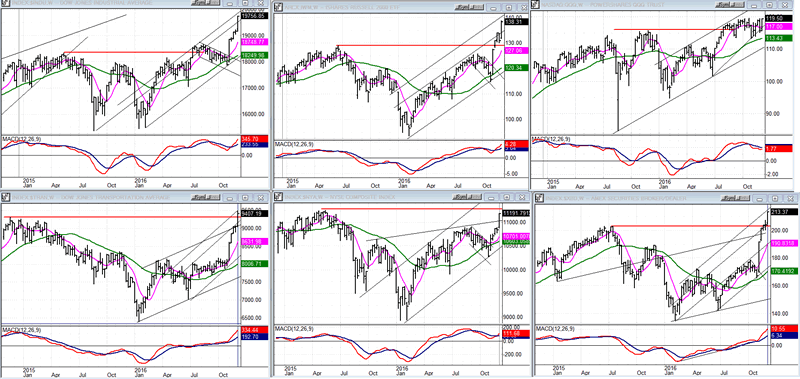
An overview of some major indexes (Weekly charts)
Last week, there were two hold-outs (top right). This week, QQQ is the only one! I have featured it as a leading indicator which could be warning of a top. But considering the bullishness depicted by the other five indexes in this group, we should be careful about arriving at long-term bearish conclusions until others join in.
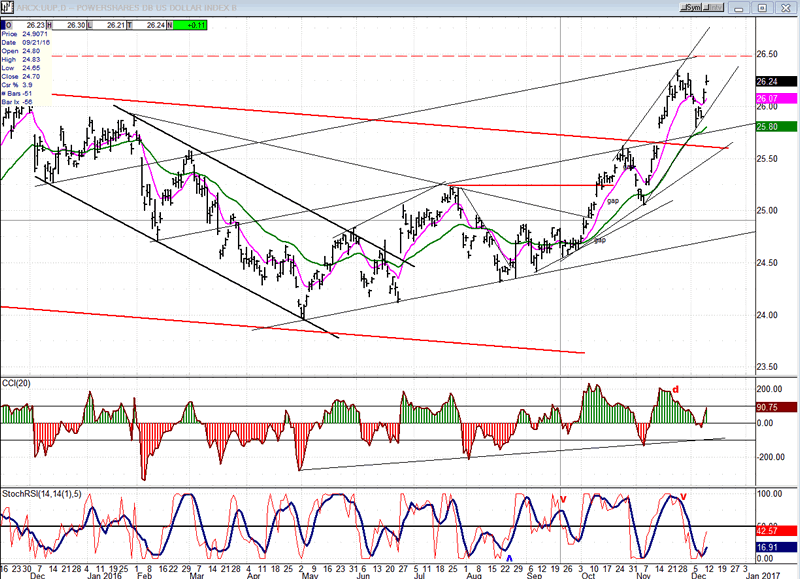
UUP (dollar ETF)
After a brief pull-back, UUP is resuming its uptrend, but it may only be a test of the highs (or is it ready to get past it's march 2015 top?). If the FED does raise interest rates on Wednesday, it should be given another boost. We'll know then if it is ready to extend its uptrend, and by how much.
GDX (Gold Miners ETF)
Last week, GDX showed additional signs of weakness, but caution should be exercised! If it cannot follow through over the next few days, all it is doing is adding to its base in preparation for a significant move in the other direction.
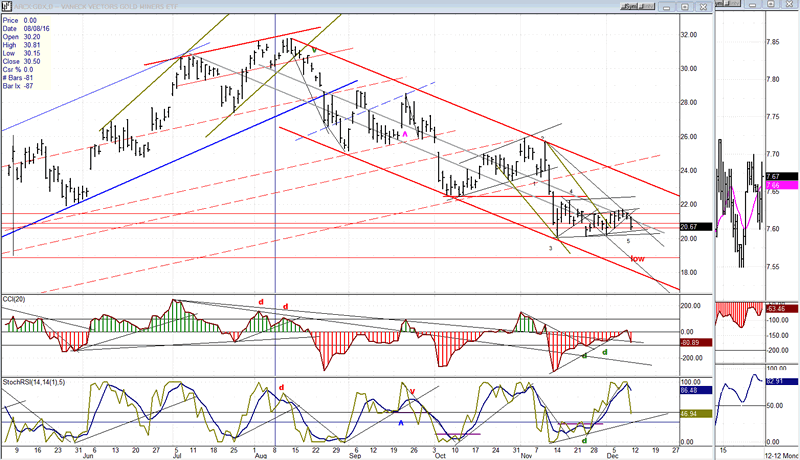
Note: GDX is now updated for subscribers several times throughout the day (along with SPX) on Marketurningpoints.com.
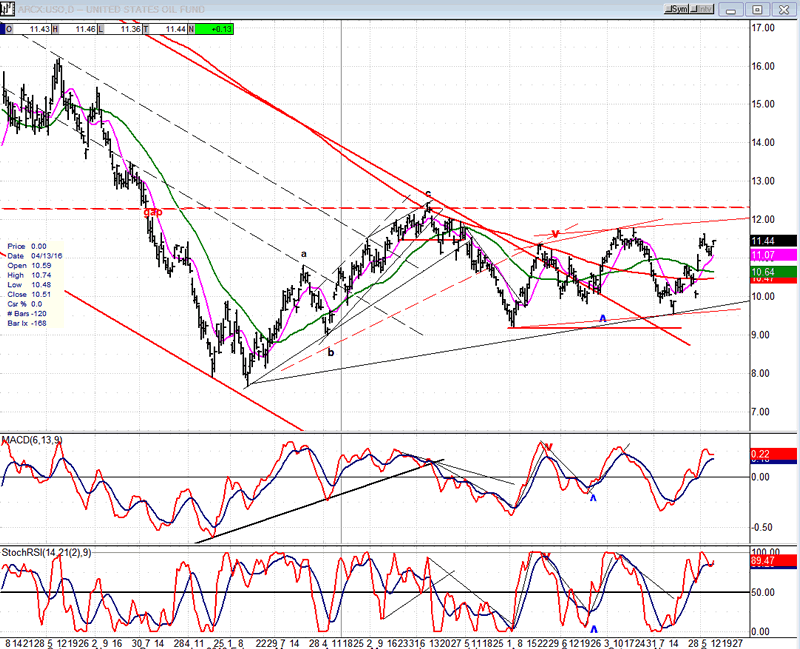
USO (U.S. Oil Fund)
USO is in a short-term uptrend which still does not show any sign of being over. If it can rise above the dashed line, it could move up to about 15.50.
Summary:
The NYA is now the only major index which has not made a new all-time high, but it came very close to doing so last week. There is evidence that we are quickly coming to an intermediate top, but this is all it might be, and calling for an end to the bull market at this time would be premature.
Andre
FREE TRIAL SUBSCRIPTION
If precision in market timing for all time framesis something that you find important, you should
Consider taking a trial subscription to my service. It is free, and you will have four weeks to evaluate its worth. It embodies many years of research with the eventual goal of understanding as perfectly as possible how the market functions. I believe that I have achieved this goal.
For a FREE 4-week trial, Send an email to: info@marketurningpoints.com
For further subscription options, payment plans, and for important general information, I encourage
you to visit my website at www.marketurningpoints.com. It contains summaries of my background, my
investment and trading strategies, and my unique method of intra-day communication with
subscribers. I have also started an archive of former newsletters so that you can not only evaluate past performance, but also be aware of the increasing accuracy of forecasts.
Disclaimer - The above comments about the financial markets are based purely on what I consider to be sound technical analysis principles uncompromised by fundamental considerations. They represent my own opinion and are not meant to be construed as trading or investment advice, but are offered as an analytical point of view which might be of interest to those who follow stock market cycles and technical analysis.
Andre Gratian Archive |
© 2005-2022 http://www.MarketOracle.co.uk - The Market Oracle is a FREE Daily Financial Markets Analysis & Forecasting online publication.