


Soft Commodities and the SPX Stocks Bull Market
Stock-Markets / Stock Market 2017 Jan 08, 2017 - 03:56 AM GMTBy: Tony_Caldaro

 The week started on Tuesday at SPX 2239. The market gapped up to start the week, hit SPX 2264, sold off to 2245, then gapped up on Wednesday to hit 2273. Thursday the market pulled back to SPX 2260. Then on Friday the SPX made all-time new highs at 2282. For the week the SPX/DOW gained 1.45%, and the NDX/NAZ gained 2.95%. Economic reports for the week were slightly positive. On the downtick: the ADP, monthly payrolls, unemployment, factory orders, plus the trade deficit increased. On the uptick: construction spending, ISM manufacturing, auto sales, the WLEI, the Q4 GDP estimate, plus weekly jobless claims declined. Next week’s reports will be highlighted by retail sales, business/wholesale inventories and consumer credit.
SOFT COMMODITIES
As noted in the last report on Gold, commodities move in approximate 30-year cycles: 10 years up and 20 years down. Commodity peaks, in the last century, occurred in 1920, 1951, 1980 and 2011. While most commodities track this cycle quite well, soft commodities such as Corn, Soybeans, Cotton, etc. can deviate somewhat due to weather conditions and government price fixing.
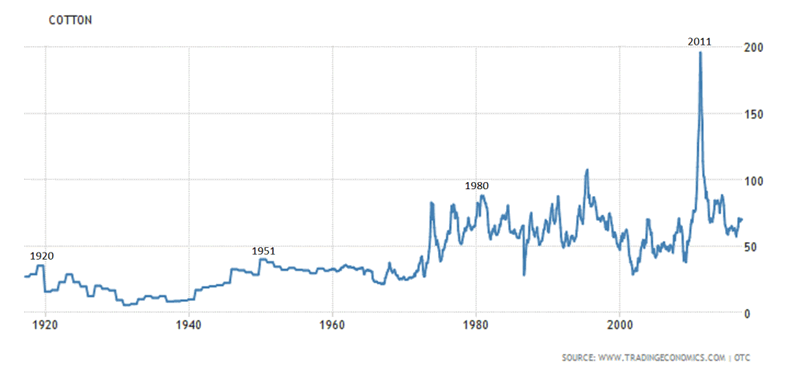
The price of Cotton, over the last century, has generally followed the 30-year commodity cycle. Peaks have occurred within a year or so of commodity cycle peaks, with weather related price spikes in between. These price spikes would make it difficult to uncover a long-term cycle, but they are actually an harmonic within the larger cycle.
A closer look at Cotton from 1970-present displays the 30-year cycle noted in black numbers, and the harmonics of this cycle are noted in blue and green numbers. As you will observe even the harmonics have a pattern. Cotton was in a cyclical bull market from 1970-1980, and from 2001-2011 – which matched Gold’s cycle perfectly. In between, a cyclical bear market unfolded from 1980-2001. Cotton is currently in another cyclical bear market, which should bottom within a year, or so, of the year 2031.
The first harmonic, or sub-cycle, is simply 10-years up then 6-years down and is noted in blue: 1970-1980, 1986, 1986-1995, 2001, 2001-2011. Notice it is aligned with the 10-year bull market, and displays about a 10-year rise in the middle of the 20-year bear market. Since Cotton peaked in the year 2011, this suggests a tradable low in the year 2017.
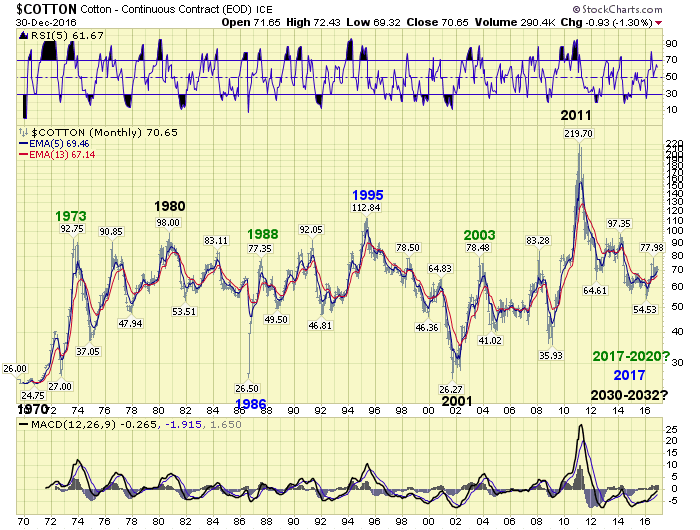
The second harmonic applies only to the price action of the 10-year advances within the first harmonic. After every 6-year low there is a spike in price lasting 2-3 years, followed by a steep decline. Then the bull phase resumes. Notice the three spikes off the 6-year lows: 1970-1973, 1986-1988, and 2001-2003. This suggests once the 2017 low is in for Cotton it should have a price spike lasting 2-3 years.
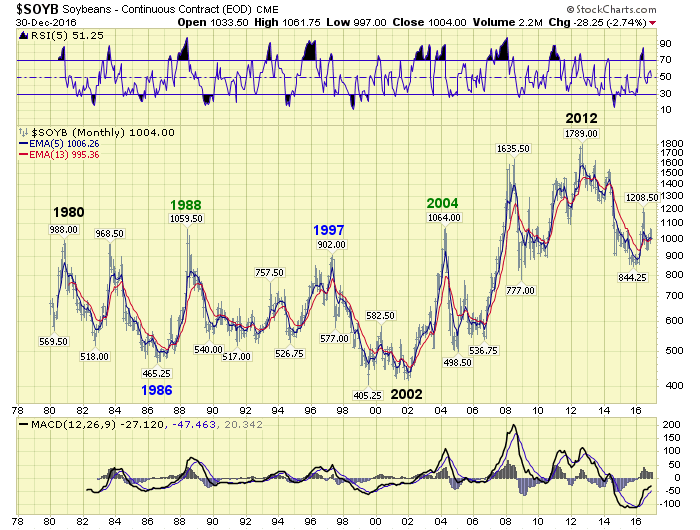
Each of the soft commodities should have peaks and lows within about one year of the general 30-year cycle, and the harmonics previously noted. Each individual commodity should be tracked to determine its own specific turn dates. The Soybean chart above provides an example of the possible date offsets. Hope this helps those inclined to trade the Softs.
LONG TERM: uptrend
An interesting first week to start the year. Unlike last year, when the market gapped down to start the year and then followed Crude in its waterfall decline to $26. This year the market started with two gap up openings and ended each day higher than where it opened. The NYSE finally made a bona fide new high, five months after the NDX/NAZ and six months after the SPX/DOW. This along with another tidbit of data, that we cannot disclose, confirms what we have suspected for most of this year. The NYSE has become an international index, that is NOT representative of the US stock market. The last hope for a quantified Primary V is now gone. As a result we have dropped the NYSE charts to the bottom of the second page in stock charts.
In addition to giving consideration to a potential Primary V, in the first half of the year, we also considered a potential Major B wave advance. This second pattern suggested a potential corrective rise to new all-time highs that could unfold in a diagonal triangle or a double zigzag. We have all these counts posted on the NYSE charts. The overall action in the DOW and NAZ totally eliminates any sort of diagonal triangle scenario. There simply isn’t any rising triangular formation underway. The last potential bearish scenario, a double zigzag B wave, will be eliminated when the SPX exceeds 2336. Thus far this potential pattern is still possible.
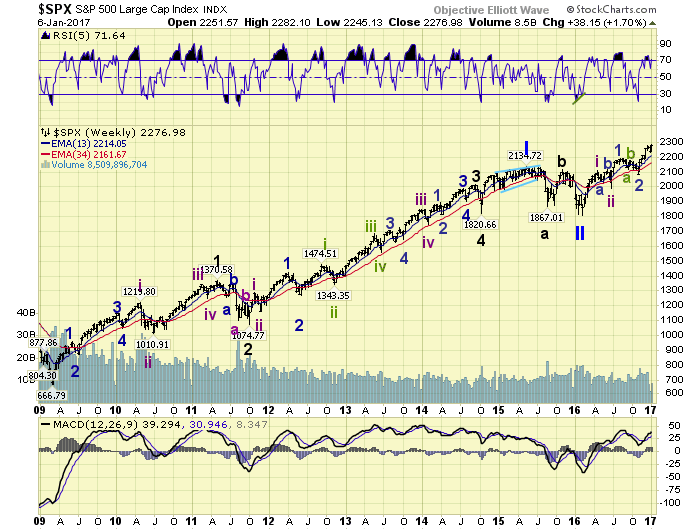
With the Primary V and diagonal triangle Major B now out of the way we can continue to concentrate on the Primary III bull market at hand. As labeled on the chart above. A Primary I bull market unfolded from 2009 at SPX 667 to 2015 at SPX 2135. Then a brief Primary II bear market unfolded bottoming in 2016 at SPX 1810. Since then the SPX has been in a Primary III bull market, which is still in its early stages. Our initial target, after SPX 2336 is cleared, is SPX 3000+ by 2018-2020.
MEDIUM TERM: uptrend
Primary III has thus far unfolded in three impulsive uptrends: Feb-Apr, Jun-Aug, and Nov-Jan. We have labeled these three uptrends as: Int. i and ii, Minor 1 and 2, and possibly Minor 3 underway. The first uptrend advanced about 300 pts. over 2 months, the second uptrend about 200 pts. over 2 months, and this third uptrend is about 200 pts. over 2 months. The downtrends have declined about 100 pts. each over 2-3 months. Thus far the trends have been quite consistent.
While these trends have been unfolding we have been trying to hone in on this bull market’s internal characteristics – the wave activity within the trends. We had observed one view, added another view, then recently expanded it to a few more, and now have contracted it back to two again. The newer view will be discussed in this section. And the older view, which most have followed, in the short term section below.
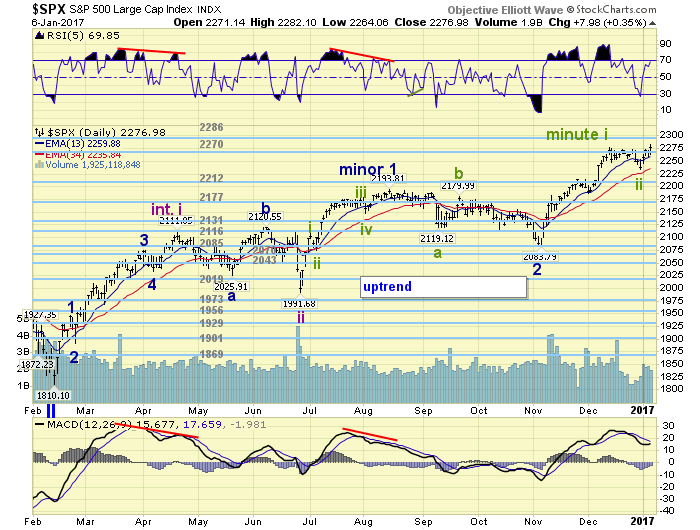
Since Int. i was about 300 pts. and Minor wave 1 about 200 pts., we have been expecting Minor wave 3 to be around 300 pts. Thereby giving it an upside target in the SPX 2380’s. Third waves are almost always longer than first waves. At last month’s SPX 2278 high we could count five waves up from the Minor 2 downtrend low at SPX 2084: 2147-2125-2214-2187-2278. After that high the market had its largest pullback since the uptrend began: 44 pts. versus 22 and 27 pts. This 44 pt. pullback also retraced about 23.6% of the entire uptrend. After that SPX 2234 low a week ago Friday the market rallied to new highs just yesterday at SPX 2282. This view suggests Minute wave i, of Minor 3, ended at SPX 2278. Minute wave ii ended at SPX 2234. And Minute iii is currently underway. This is quite a bullish count, and has a qualifier noted below. Medium term support is at the 2270 and 2212 pivots, with resistance at the 2286 and 2321 pivots.
SHORT TERM
The older version of this bull market’s characteristics everyone should be familiar with, as the counts have been posted on the hourly charts for some time. This version suggests this uptrend has already completed four Minute waves with the fifth underway: 2214-2187-2278-2234-2282 thus far. Should this count be correct, the wave degrees will probably be downgraded one degree since this uptrend is probably not all of Minor 3.
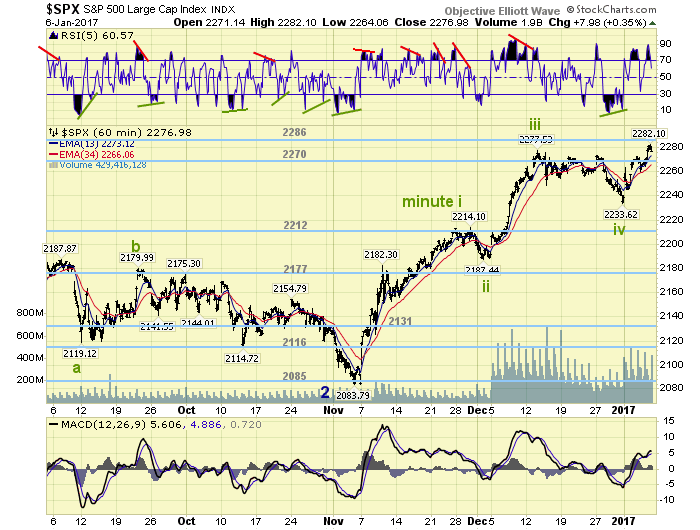
The characteristics of this count display a third wave that is shorter than the first. This of course implies the fifth wave has to be the shortest of three waves. This limits the upside potential for this uptrend to between SPX: 2279 and 2325. And herein lies the qualifier for these two counts. Should the uptrend end within the above range, then the correct count is posted on the hourly chart. Should the uptrend continue beyond SPX 2325, then the correct count is posted on the daily chart. Interesting juncture! Short term support is at the 2270 pivot and SPX 2245, with resistance at the 2286 and 2321 pivots. Short term momentum ended the week overbought. Best to your 2017 trading!
FOREIGN MARKETS
Asian markets were all higher on the week for a net gain of 1.8%.
European markets were also all higher and gained 1.6%.
The DJ World index gained 1.8%.
COMMODITIES
Bonds may be starting an uptrend and gained 0.3% on the week.
Crude remains in an uptrend and gained 0.5%.
Gold is also in an uptrend and gained 1.8%.
The USD may be entering a downtrend and lost 0.1%.
NEXT WEEK
Monday: consumer credit at 3pm. Tuesday: wholesale inventories. Thursday: export/import prices, weekly jobless claims and the budget deficit. Friday: the PPI, retail sales, business inventories and consumer sentiment.
CHARTS: http://stockcharts.com/public/1269446/tenpp
After about 40 years of investing in the markets one learns that the markets are constantly changing, not only in price, but in what drives the markets. In the 1960s, the Nifty Fifty were the leaders of the stock market. In the 1970s, stock selection using Technical Analysis was important, as the market stayed with a trading range for the entire decade. In the 1980s, the market finally broke out of it doldrums, as the DOW broke through 1100 in 1982, and launched the greatest bull market on record.
Sharing is an important aspect of a life. Over 100 people have joined our group, from all walks of life, covering twenty three countries across the globe. It's been the most fun I have ever had in the market. Sharing uncommon knowledge, with investors. In hope of aiding them in finding their financial independence.
Copyright © 2016 Tony Caldaro - All Rights Reserved Disclaimer: The above is a matter of opinion provided for general information purposes only and is not intended as investment advice. Information and analysis above are derived from sources and utilising methods believed to be reliable, but we cannot accept responsibility for any losses you may incur as a result of this analysis. Individuals should consult with their personal financial advisors.
Tony Caldaro Archive |
© 2005-2022 http://www.MarketOracle.co.uk - The Market Oracle is a FREE Daily Financial Markets Analysis & Forecasting online publication.