


Stock market and natural resources recovery continues
Stock-Markets / Metals & Mining Mar 21, 2007 - 10:31 PM GMTBy: Clif_Droke

The market indicated its super-oversold condition to us soon after the Feb. 27 sell-off based on volume and put/call ratio indications. The bottom has since been confirmed and Wednesday witnessed the big rally day everyone has been waiting for. The market rewarded our patience on Wednesday by rallying 24 points, or 1.71%, as measured by the S&P 500 index (SPX).
As of Wednesday the number of stocks making new 52-week highs on the NYSE was 239 versus only 19 new lows. The number of new lows over the past week has held consistently below 40, a sign that internal selling pressure is almost non-existent. That's a big positive from a technical standpoint and it proves that the recent damage done by the Feb. 27 panic selling was over-done and bound to be recovered. As of Wednesday we've recovered most of those losses as measured by the SPX.
Market breadth has also looked good ever since that volume reversal day last Tuesday and today (Mar. 21) the advancing issues on the NYSE were outpacing the decliners by a margin of almost 60% in late afternoon trading. Upside-to-downside volume was in favor of upside volume by 89%.
An interesting thing could be noticed in the charts of the NASDAQ 100 index (NDX) and the QQQQ. Both closed above their 15-day moving averages on Monday to confirm the short-term bottom we've been discussing. NDX and QQQQ are also among the only major indices/ETFs in which Monday's closing price was above the closing price of March 12. Thus, we had a leading indication of more technical improvement in the market with the promise of further improvement to follow. This has certainly proven to be the case as the major indices rallied strongly on Wednesday. The S&P 500 index has recaptured most of its losses since the panic selling of Feb. 27.
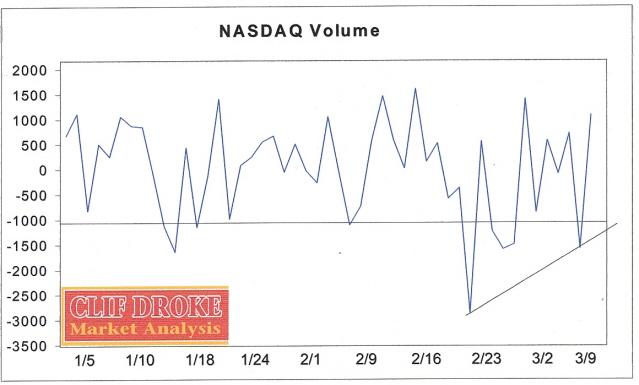
Factor in all those positive volume divergences across the board that we've been talking about lately and quite a number of bullish (short-term) chart patterns among the Dow 30 component stocks (especially AT&T) and we have the makings of a turnaround. To refresh your memory, take a look at that positive divergence in the NASDAQ Volume indicator chart shown below.
Another indication that the global market scare will be short-lived is the recent action of the Shanghai Composite Index (SSE). The SSE is the index that basically got the ball rolling on the global correction the markets have been through in late February through mid-March. As of Tuesday, Mar. 20, the SSE had completely retraced all of its losses and made a full recovery on an intraday basis, closing at its all-time high on Tuesday. Thus the first major event-driven panic has recovered nearly all its losses just as expected based on history. This proves what I've been saying since the panic began that losses following an even-driven panic are usually recovered within a short time.
The stock market is temporarily “overbought” based on the oscillators so a temporary pullback or correction wouldn't be out of place here. But the main trends remain up going forward.
The gold/silver, oil and natural gas stock recovery we've talked about in the past couple of weeks is materializing as expected so far. Oil and natural gas stocks did especially well on Wednesday, with the Amex Oil Index (XOI) closing up 1.44% at just below its February high of 1,183. The Amex Natural Gas Index (XNG) was meanwhile 1.46% higher at 467.36. XNG succeeded in making a new high for the year on Wednesday. This was brought to you courtesy of the rising 120-day internal momentum indicator for resource stocks that we mentioned earlier this month.
For a picture of how I envision the gold stocks may recover in the next few weeks before the next peak is in, take a look at the daily chart of mining stock Anglo American (AAL:UK) as shown above. Note the sharp downside move to test the recent floor at around the 2,300 level following the late-February sell-off. Then a recovery followed that has so far taken AAL back up to its previous highs, or nearly so. Might we not see a similar episode take place in HUI in the coming weeks?
By Clif Droke
www.clifdroke.com
Clif Droke is editor of the 3-times weekly Momentum Strategies Report which covers U.S. equities and forecasts individual stocks, short- and intermediate-term, using unique proprietary analytical methods and securities lending analysis. He is also the author of numerous books, including most recently "Turnaround Trading & Investing." For more information visit www.clifdroke.com
© 2005-2022 http://www.MarketOracle.co.uk - The Market Oracle is a FREE Daily Financial Markets Analysis & Forecasting online publication.