


Stock Market New Highs For 2017? Yes, But When Do I Enter?
Stock-Markets / Stock Market 2017 Jan 22, 2017 - 05:13 PM GMTBy: Chris_Vermeulen

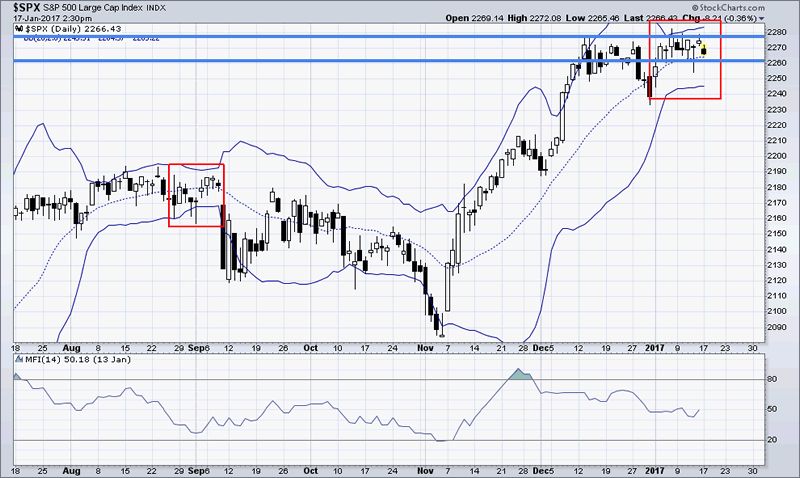
 When the SPX breaks out above its’ current resistance level, it will be the next leg up in this bull market. We are currently in a consolidation period. The SPX seems to be resting for now! The “Bollinger Bands Squeeze” is now taking hold and will result in a powerful move in either direction once broken. I do have a new BULLISH trigger for members to enter into during this amazing “melt up” that will only be shared with my ‘elite members’. I can assure you that you will want to be invested in this next BULLISH leg of the SPX!
The Next Move UP!
‘Bollinger Bands’ are one of my most preferred tools of technical indicators:
The “Squeeze”,(http://www.investopedia.com/articles/technical/04/030304.asp?lgl=bt1tn-baseline-below-textnote) occurs during low levels of volatility as the ‘Bollinger Bands’ narrow. These periods of low volatility are followed by periods of high volatility. Therefore, a volatility contraction of the bands can foreshadow a significant advance or decline. This is one of my best kept secrets of technical analysis, until now!
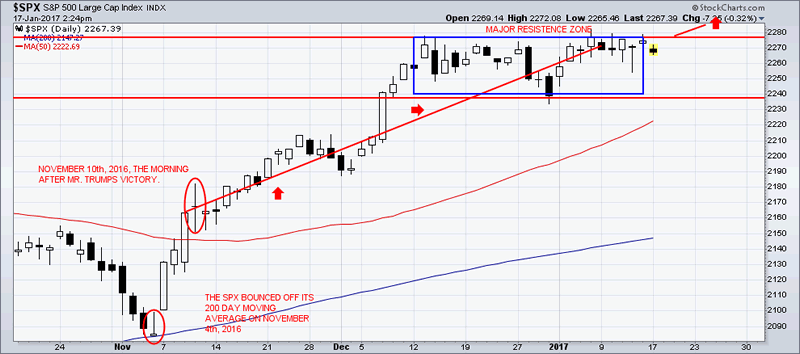
Financial markets are now awaiting what the new Trump Administration has in store. These markets do not like “uncertainty”. So far, President-elect Trump has announced a direction of deregulation and lowering the tax bracket for corporations and repatriation of all corporate money (http://www.investopedia.com/terms/r/repatriation.asp) that is held overseas in foreign bank accounts.
The ‘ISI Research Study’ revealed that the “U.S. S&P 500 companies now have $1.9 trillion parked outside the country”. Most likely, said funds will be applied so as to continue the stock buyback program thereby pushing the SPX to new levels that are ridiculously overpriced. Hot money ‘continues to be supporting the rise in equity markets. I share some of these hot money sectors and stock on my StockCharts.com public list!
Trump’s Victory Speech on November 9th, 2016:
“We are going to fix our inner cities and rebuild our highways, bridges, tunnels, airports, schools, hospitals. We’re going to rebuild our infrastructure, which will become, by the way, second to none. And we will put millions of our people to work as we rebuild it. We will also finally take care of our great veterans”.
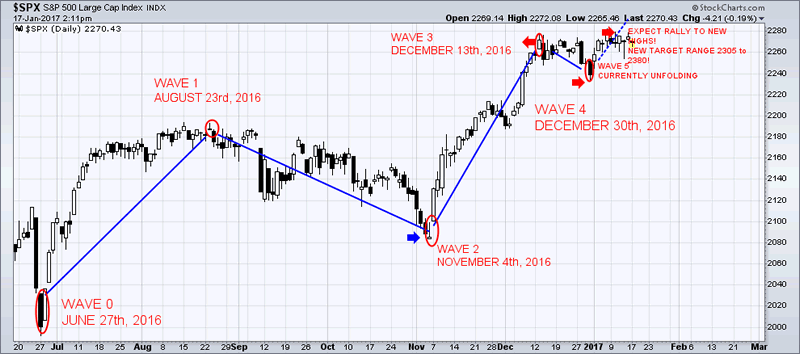
Chart of the SPX “melt-up’:
Are there too many happy investors?
The U.S. stock markets have been on a run since the U.S. Presidential election last November 9th, 2016.
U.S. stocks continue to see signs of “optimistic extremes”. The risk of buying on emotional decisions is still currently high.
There is no interest in shorting. The number of shares sold short, in hopes of buying them back at a lower price, has collapsed. The SPY fund (https://us.spdrs.com/en/product/fund.seam?ticker=SPY), short interest is the lowest since the summer of 2007. Individual stocks are also showing a lack of short sales which, in turn, removes a pool of potential buying interest. A “de-trended” version of the short interest ratio has dropped to a level that has led to negative returns for stocks which will happen, but likely not for many month yet. The market is likely to grinding higher before a big correction takes place.
A new high presented itself on a day that the jobs report missed expectations. On January 6th, 2017, the jobs report came in less than what economists’ expectations were. However, the SPX powered to a new high of 2276.06. This may seem like good news, but during prior times that this occurred, stocks usually pulled back over the following weeks.
Stocks have drifted higher even after optimism reached an extreme. ‘Dumb Money Confidence’ exceeded 80% but the SPX has added on more gains without any kind of pullback. This type of buying pressure, after an extreme optimism sentiment, has previously occurred only a handful of times. It has usually led to losses as the late buyers became “exhausted”.
Investor confidence is so High they see no need to hedge their positions:
The Equity Hedging Index has declined to its’ lowest level in nearly two years, showing a lack of interest in the various ways that investors use to protect themselves from possible market declines.
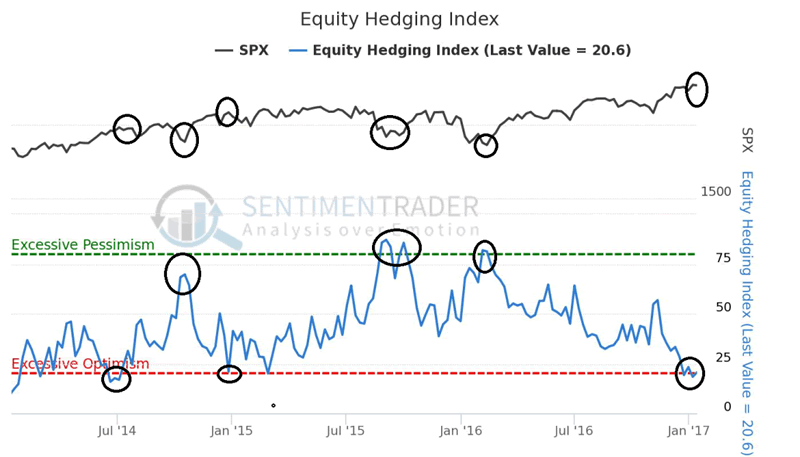
This chart is a contrary indicator. The higher the Equity Hedging Index, the more likely it is that stocks will rally going forward. The lower the Equity Hedging Index, the less likely that stocks will rally.
Conclusion:
Hopefully, Trump’s business experience will translate well into his new position. It is certainly my hope that he is as successful as possible. Even during the campaign Trump spoke about how stocks were in a giant ‘bubble’. This euphoria that we have felt, since his election victory, has made that ‘bubble’ even larger. Throughout U.S. history, every ‘giant financial bubble’ has always ended very badly, and this time around will not be an exception. Trump may get the blame for it when it bursts, but the truth is that the conditions for the coming crisis have been building for a very, very long time.
I expect the stock market to stall out mid way this year in June/July at which point things could turn south. If you want to follow me live at StockTwits.com
Join my free trading newsletter at www.TheGoldAndOilGuy.com
Chris Vermeulen
Chris Vermeulen is Founder of the popular trading site TheGoldAndOilGuy.com. There he shares his highly successful, low-risk trading method. For 7 years Chris has been a leader in teaching others to skillfully trade in gold, oil, and silver in both bull and bear markets. Subscribers to his service depend on Chris' uniquely consistent investment opportunities that carry exceptionally low risk and high return.
Disclaimer: Nothing in this report should be construed as a solicitation to buy or sell any securities mentioned. Technical Traders Ltd., its owners and the author of this report are not registered broker-dealers or financial advisors. Before investing in any securities, you should consult with your financial advisor and a registered broker-dealer. Never make an investment based solely on what you read in an online or printed report, including this report, especially if the investment involves a small, thinly-traded company that isn’t well known. Technical Traders Ltd. and the author of this report has been paid by Cardiff Energy Corp. In addition, the author owns shares of Cardiff Energy Corp. and would also benefit from volume and price appreciation of its stock. The information provided here within should not be construed as a financial analysis but rather as an advertisement. The author’s views and opinions regarding the companies featured in reports are his own views and are based on information that he has researched independently and has received, which the author assumes to be reliable. Technical Traders Ltd. and the author of this report do not guarantee the accuracy, completeness, or usefulness of any content of this report, nor its fitness for any particular purpose. Lastly, the author does not guarantee that any of the companies mentioned in the reports will perform as expected, and any comparisons made to other companies may not be valid or come into effect.
Chris Vermeulen Archive |
© 2005-2022 http://www.MarketOracle.co.uk - The Market Oracle is a FREE Daily Financial Markets Analysis & Forecasting online publication.