Commodities Super Cycle Heading for Demand Destruction?
Commodities / Resources Investing Aug 07, 2008 - 03:07 PM GMTBy: Gary_Dorsch

 Jesse Livermore, the world's greatest trader used to say, “Remember, the market is designed to fool most of the people most of the time. Sometimes, the market will go contrary to what speculators have predicted. At these times, speculators must abandon their predictions and follow the action of the market. Never argue with the tape. Markets are never wrong, but opinions often are. I only try to react to what the market is telling me by its behavior,” he said.
After Reuters CRB Index of 19-exchange traded commodities plunged by 10% in July, its biggest monthly decline since March 1980, the five-year bull-run for the “Commodity Super Cycle” appears to have peaked out, and speculators are building net short positions in commodities. “I came to learn that even when one is properly bearish at the very beginning of a bear market, it is not well to begin selling in bulk until there is no danger of the engine back-firing,” Livermore warned.
“The bull market in crude oil started in 1999, and in the last nine-years the oil market has gone down over 40% three times. Was that the end of the bull market?” asked famed investor Jimmy Rodgers on July 29th. In a world of limited resources, the world's population is expected to increase by a third to 9.1 billion persons over the next 40-years, with more than 95% of the increase in demand concentrated in developing countries.
Still the new buzzword in the trading pits is “demand destruction,” a favorite slogan for short-sellers in the commodity markets. After setting an all-time high a month ago on July 2nd, and up 40% from a year earlier, the Dow Jones Commodity Index (DJCI) suddenly finds itself on the brink of bear market territory, after an -20% slide from its peak, and faring no better than the MSCI All-World Stock Index, which has been mutilated by the bear's claws, for the past nine months.
“Demand destruction,” the new flavor of the month, refers to a sustained reduction in demand for a commodity, following a prolonged period of extra-ordinary high prices. For example, Americans shunned pickups and SUV's in June, with retail gasoline prices moving above $4 per gallon, while sales of many fuel efficient car models went up. Sales of GM's light trucks and SUVs tumbled 16% in June, while Toyota Motor saw a 15% jump in sales of its compact Corolla, and as a result, US-demand for gasoline is roughly 3% lower from a year earlier.
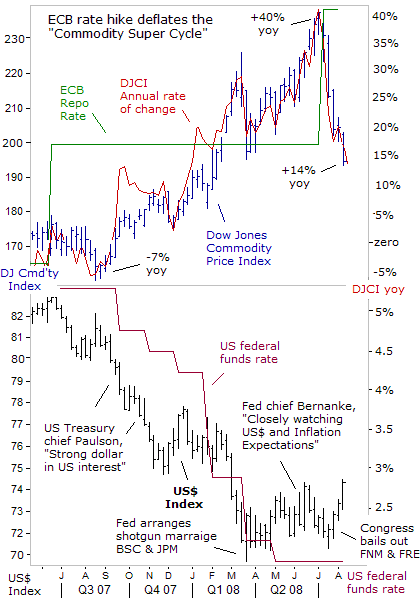
Historically, every “Oil Shock” since 1972 has tipped the global economy into a recession, which in turn, has weakened demand for industrial commodities. But the recent declines in industrial commodities were also accompanied by equally sharp slides in agricultural commodities like corn, soybeans, wheat and rice, suggesting a broader exodus by hedge funds and other big speculators is underway.
History will show that the July 2nd peak in the “Commodity Super Cycle,” coincided with the European Central Bank's courageous move on July 3rd, to lift its repo rate by a quarter-point to 4.25-percent. The ECB hawks refused to be bullied by Euro-zone politicians into a series of rate-cuts, or join the Fed's money printing orgy, even while banks and brokers worldwide had recognized $480 billion of write-offs from toxic-sub-prime mortgages, over the previous 12-months.
Instead, the ECB held its repo rate steady at 4% through the first-year of the global banking crisis, then guided German schatz yields to a six-year high. The ECB got the pay-off it was hoping for, when the commodity markets subsequently plunged, led by a $30 /barrel drop in crude oil, and 20% losses in the agricultural sector.
The world economy needed a powerful central bank to go against the “Big-Easy” at the US Treasury and the Fed, and the “yen carry” traders at the Bank of Japan, in order to deflate the oil and commodity “bubble” with a classic dose of higher interest rates. The ECB's baby-step rate hike was the tipping point, where market psychology switched from “fears of inflation” to worries about “demand destruction.”
The ECB hawks received back-up support from central bankers in Brazil, China, India, and Russia, which tightened their monetary policies in July, in order to combat inflation and slow their economies. Later this week, the Bank of Korea is expected to hike its overnight loan rate to 5.25%, to shore-up the value of the Korean-won and rein-in the explosive growth of the money supply.
The ECB hawks repudiated the advice of the ultra-inflationist Frederic Mishkin, a top advisor to Benjamin S. Bernanke at the Federal Reserve. “Just as doctors take the Hippocratic Oath to do no harm, central banks should recognize that trying to prick asset-price bubbles using monetary policy is likely to do more harm than good. Interest rates are too blunt a tool for targeting specific asset prices, and attempting to prick an asset price bubble should be avoided,” he said on May 15th.
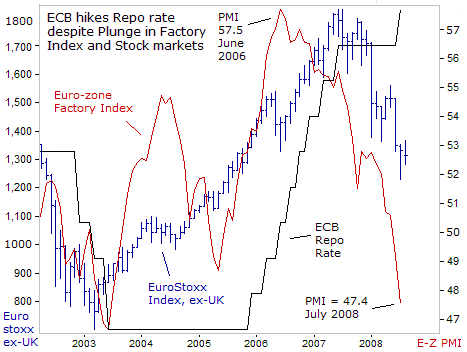
Six weeks later, the ECB hiked its repo rate to 4.25%, and greased the skids under the commodity and global stock markets. The annual rate of change for the DJ Commodity Index has plunged to +14% today, from a record high of +40% a month ago. Government apparatchniks will soon begin to report a significant slowdown in official inflation rates, giving central banks more time to keep interest rates low, or the leeway to ease monetary policy where interest rates are historically high.
But the ECB's tonic for curing global inflation was a bitter pill to swallow. Global stock markets lost $3 trillion in value over the past two months, and the “reverse wealth” effect” threatens to grind the Euro-zone economy to a halt in the third quarter. The Euro-zone's manufacturing and services sector composite index fell to seven-year low of 47.8 in July, and Spain's jobless rate jumped to 10.4%, a 10-year high.
The UK's PMI tumbled to 44.3, it's lowest since December 1998, from 45.9 in June, and British home prices have tumbled 8% in the past year, a record rate of decline. One in seven British home owners could fall into negative equity over the next year, threatening consumer spending. With commodity markets under siege from “demand destruction,” a Bank of England rate cut to 4.75% could be on the table, if commodity and stock markets continue to trend lower in the months ahead.
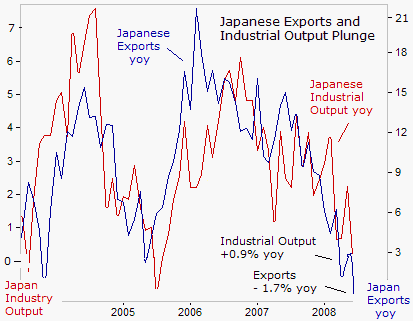
Japan's industrial production fell for the second straight quarter in April-June, the first such back-to-back decline since 2001, when output fell in all four-quarters. Since 1953, the Japanese economy has never escaped a recession when production falls for two quarters in a row. Exports, a key driver of Japan's economy, fell in June for the first time in nearly five years, as shipments to the United States plunged by 15% from a year ago, and sales to Europe and Asian markets sputtered.
Japan's trade surplus was nearly wiped out in June, plunging 90% from a year earlier to 139-billion yen ($1.3 billion), with a soaring oil bill on the one hand, and faltering exports on the other. Household spending fell for a fourth month, slipping 1.8% in June from a year earlier, and Japan's jobless rate rose to 4.1% in June, a two-year high, as factories froze hiring, signaling “demand destruction.”
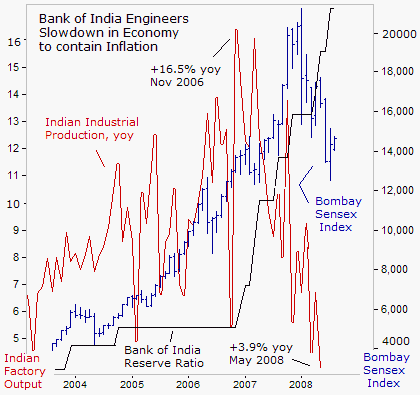
China's manufacturing sector contracted in July for the fourth consecutive month to 48.4 in July, and sub-indices for output, imports, and new export orders all fell by more than 5% from June. India's industrial production grew at the slowest pace in more than six years in May, slowing to an annual rate of +3.8% for the month from an expansion of +10.6% a year ago. Concern over the slide in industrial output and exports contributed to a 31% decline in the Bombay Stock Index this year.
India's central bank raised its benchmark rate by 50 basis points on July 29th to 9.00%, it's highest in seven years and hiked the cash reserve ratio, or the amount of funds banks must keep on deposit with the central bank, by 25 basis points to 9.0 percent. The double-barreled punch is a signal that the central bank is ready to accept slower growth, (much like the ECB), as the price for lower inflation, which is holding just below 12 percent.
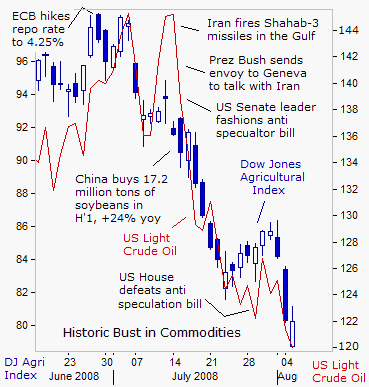
Corn and soybean prices have tumbled sharply in-line with plunging crude oil prices, since establishing contract highs in June and early July. Corn futures reached an all-time high of $7.70 /bushel on June 27th, but since declined to $5.05. Soybean futures reached a high of $16.60 on July 3rd, but fell to $12.20 on August 5th. Fears that hot weather that could damage the crops during the crucial pollination phase have eased, with cooler temperatures and rainfall expected. The world is expected to produce a record wheat crop in 2008-09.
While the dominant link between the agricultural and energy sector is the bio-fuel connection, traders can also gauge market sentiment, when bullish news is released and the market remains unchanged or moves lower. Such was the case on July 30th, when the US House Republicans defeated an anti-speculator bill, designed to tighten position limits on energy and agricultural futures contracts. Yet the bounce in the commodities markets was brief and lacked significant firepower.
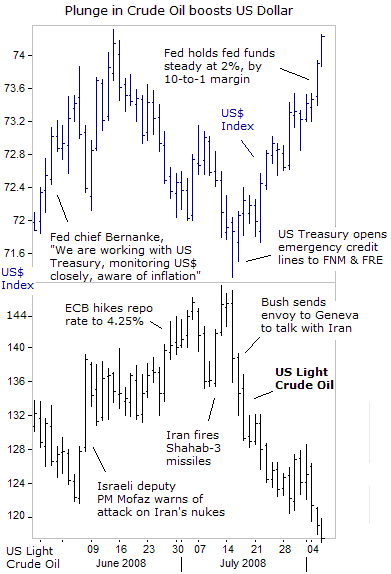
One of the most curious developments is the recent strengthening of the US dollar compared to the Euro, in-line with sharply lower oil prices. The US imports 4.5 billion barrels of oil per year, so the latest $30 /barrel decline, if sustained, can reduce America's oil import bill by roughly $135 billion per year. On the other hand, the US is also the world's largest exporter of grains, and projections of foreign sales revenue has just been sliced by 20% in the past four weeks.
Two months ago, on June 3rd, Fed chief Bernanke warned the US central bank “is working with the Treasury to carefully monitor developments in foreign exchange markets, and is aware of the effect of the dollar's decline on inflation and price expectations,” a subtle threat of stealth intervention in the currency markets. Yet Bernanke never had any intention of lifting US interest rates to bolster the dollar. Instead, the ECB turned its tough words into action, by hiking its repo rate, yet the US dollar, (not the Euro), was the eventual winner from lower oil prices.
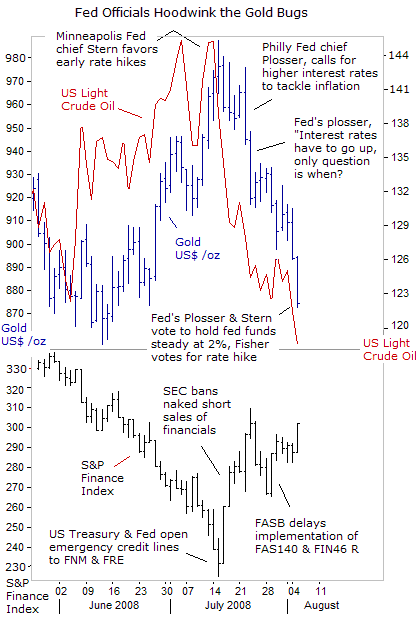
The Fed was successful in hoodwinking the gold bugs in July, by sending false signals to the mainstream media, about a tighter Fed policy, sooner rather than later. On July 18, with gold trading near $960 /oz, Minneapolis Fed chief Gary Stern warned, “headline inflation is clearly too high, and the Fed can not wait until financial and housing markets stabilize before raising interest rates,” he said.
Then on July 22nd, Philadelphia Fed chief Charles Plosser warned that keeping monetary policy too-loose for too-long could worsen inflation by allowing expectations to get entrenched into consumer and business psychology. “To keep inflation expectations anchored means that monetary policymakers will have to back up their words with actions. We need to reverse course. I anticipate the reversal will need to be started sooner rather than later,” he warned.
Then on July 23rd, Plosser warned again, “Real interest rates are negative, and we can't stay there indefinitely. We've got price pressures clearly throughout the economy. Ultimately, rates are going to have to go up,” he said. Stern and Plosser duped the gold bugs into a selling frenzy, and on August 4th, the dynamic duo flip-flopped, and voted to keep the fed funds rate steady at 2-percent.
The Fed's propaganda artists could hardly believe their good fortune, as gold and oil prices sank, even as they signaled no change in “negative” US interest rates for the remainder of the year. But as the charts above indicate, bottom fishing in US financial shares, after the US government's bailout of Fannie and Freddie, combined with sharply lower agricultural and oil energy futures, and a stronger dollar, were the chief culprits behind gold's latest plunge below $900 /oz.
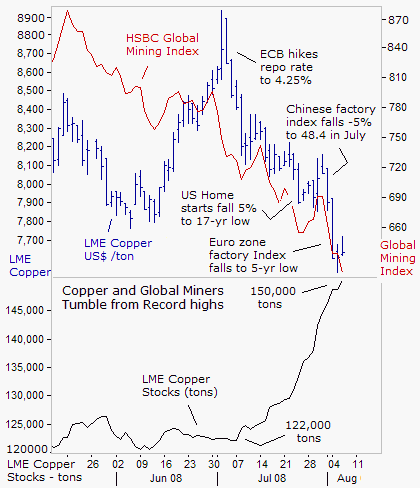
Copper prices have tumbled by 12% in the aftermath of the ECB rate hike on July 3rd, amid rising inventories on the London Metal Exchange and a slowdown in global factory activity. Stockpiles monitored by the LME jumped 22% since July 1st to 150,000 tons, and are the highest since February. The HSBC Global Mining Index fell 30% from its all-time high set in May, and the world's top 20 mining stocks have lost $670 billion in market value, over the past 10-weeks.
In the commodities markets, sentiment can turn instantly on a dime. Livermore said the market is 90% emotional and 10% logical. It's difficult to catch a falling knife, without getting hurt. For commodity bulls, OPEC's upcoming meeting on Sept 6th could be a turning point. “If there are expectations that demand will fall, or if supply is actually more than demand, OPEC will act to balance supply and demand,” said Qatari Oil Minister Abdullah al-Attiyah on August 1st. Beyond OPEC, contrarians might see the dismal readings on global factory orders as nearing a bottom.
By Gary Dorsch,
Editor, Global Money Trends newsletter
http://www.sirchartsalot.com
GMT filters important news and information into (1) bullet-point, easy to understand analysis, (2) featuring "Inter-Market Technical Analysis" that visually displays the dynamic inter-relationships between foreign currencies, commodities, interest rates and the stock markets from a dozen key countries around the world. Also included are (3) charts of key economic statistics of foreign countries that move markets.
Subscribers can also listen to bi-weekly Audio Broadcasts, with the latest news on global markets, and view our updated model portfolio for Q'1, 2008. To order a subscription to Global Money Trends, click on the hyperlink below, http://www.sirchartsalot.com/newsletters.php or call toll free to order, Sunday thru Thursday, 8 am to 9 pm EST, and on Friday 8 am to 5 pm, at 866-553-1007. Outside the call 561-367-1007.
Mr Dorsch worked on the trading floor of the Chicago Mercantile Exchange for nine years as the chief Financial Futures Analyst for three clearing firms, Oppenheimer Rouse Futures Inc, GH Miller and Company, and a commodity fund at the LNS Financial Group.
As a transactional broker for Charles Schwab's Global Investment Services department, Mr Dorsch handled thousands of customer trades in 45 stock exchanges around the world, including Australia, Canada, Japan, Hong Kong, the Euro zone, London, Toronto, South Africa, Mexico, and New Zealand, and Canadian oil trusts, ADR's and Exchange Traded Funds.
He wrote a weekly newsletter from 2000 thru September 2005 called, "Foreign Currency Trends" for Charles Schwab's Global Investment department, featuring inter-market technical analysis, to understand the dynamic inter-relationships between the foreign exchange, global bond and stock markets, and key industrial commodities.
Copyright © 2005-2008 SirChartsAlot, Inc. All rights reserved.
Disclaimer: SirChartsAlot.com's analysis and insights are based upon data gathered by it from various sources believed to be reliable, complete and accurate. However, no guarantee is made by SirChartsAlot.com as to the reliability, completeness and accuracy of the data so analyzed. SirChartsAlot.com is in the business of gathering information, analyzing it and disseminating the analysis for informational and educational purposes only. SirChartsAlot.com attempts to analyze trends, not make recommendations. All statements and expressions are the opinion of SirChartsAlot.com and are not meant to be investment advice or solicitation or recommendation to establish market positions. Our opinions are subject to change without notice. SirChartsAlot.com strongly advises readers to conduct thorough research relevant to decisions and verify facts from various independent sources.
Gary Dorsch Archive |
© 2005-2022 http://www.MarketOracle.co.uk - The Market Oracle is a FREE Daily Financial Markets Analysis & Forecasting online publication.


