EURUSD Forex Trading Strategy Simplifies a Choppy Market
Currencies / Euro Jan 31, 2017 - 11:47 AM GMTBy: Nicholas_Kitonyi

 The forex market accounts for trillions worth of transactions on a daily basis, which makes it one of the most liquid markets to participate in. The EUR/USD currency pair accounts for most of those transactions but that does not make the pair immune to the rigorous volatility experienced amongst the exotic currency pairs.
Due to less liquidity, currency markets involving less popular pairs tend to be more volatile than their more popular counterparts. However, as demonstrated in the chart below, the EUR/USD pair, which is one of the most popular currency pairs in the Forex market has been very choppy of late. At least, when you look at it from the perspective of the hourly chart.
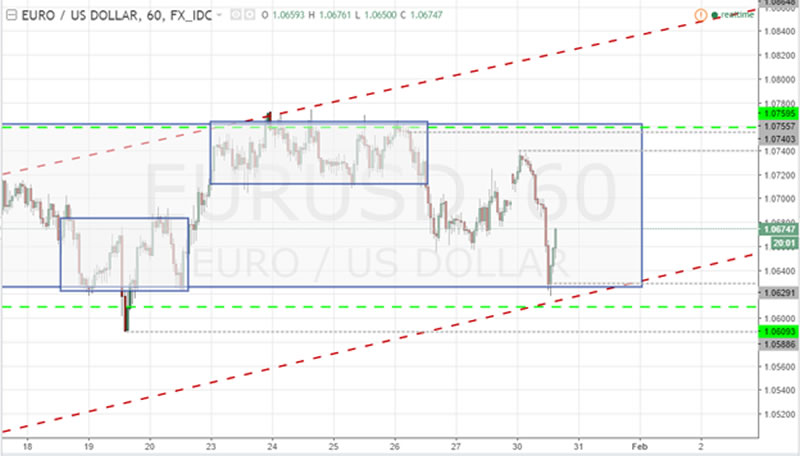
Trading in such a market can be very tricky even for the most experienced traders, and that’s why most forex trading experts always advise against trading in a choppy market. It is so difficult to identify the right periods to open and close a trade. Yet, some people still profit when the market seems to be stuck on a sideways movement.
So, how do they do it?
Different traders have their own unique trading strategies. Some tend to beat the market while others fail to net profits on a regular basis. However, one of the best strategies for trading a choppy market as per several forex trading courses involves looking at the market from different angles. It is pretty clear that trading opportunities are never easy to spot in any market, trending or otherwise. Instead, opportunities tend to hide in plain sight.
This is why even when the markets are as choppy as they currently are, there will always be some people making money. To illustrate how they do it, it is ideal to use an example of a currency pair that bears the characteristics of a choppy market. And as noted in this article, the EUR/USD pair is a perfect example. In the chart above, it looks ominous to try and pick a bullish or bearish position. However, when you use the theory of multiple-timeframe charts, the picture begins to form some short-term trends.
For instance, look at the chart below, it’s the 4-hour chart for the EUR/USD pair.
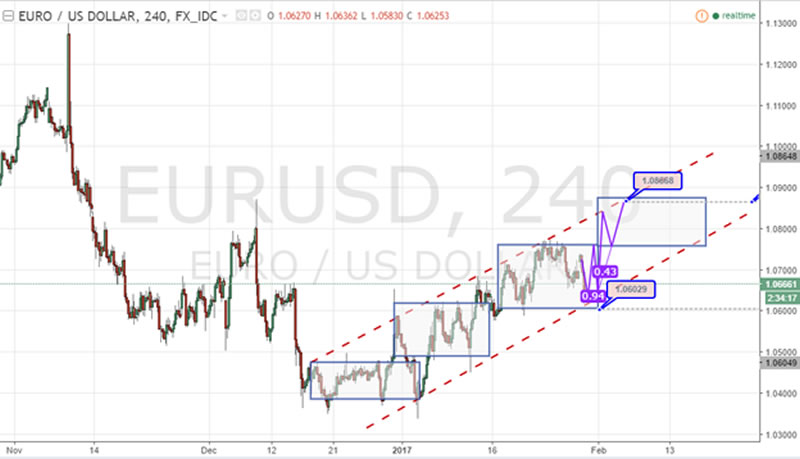
As demonstrated in the 4-hour chart above, there seems to be some short-term breakouts coming after every couple of weeks of a sideways movement. And going by this demonstration, it’s pretty easy to say that the next short-term breakout could be around the corner.
In that case, it gives traders a more visible trading opportunity as compared to using just the hourly chart in the first image of this article. Nonetheless, this does not clear up things completely. Given the current exchange rate of about 1.0666, technical analyses indicate that there is a possibility that the rate could as well fall to 1.0600.
However, if the upward breakout takes places as has been the case over the last two months, then it would be ideal to target to take profits at 1.0800-1.0880. The immediate major resistance zone after the breakout would be within that trading range as demonstrated in the chart above.
So, what should the traders do to confirm whether to open a bullish position on the pair? The simple answer is to expand the time frame by opening the daily chart.
Now, as shown in the daily chart below, the EUR/USD currency pair has been characterized by a series of higher highs and higher lows since the US federal reserve hiked interest rates in December. While this seems awkward under normal circumstances, it seems that US President Donald Trump has been doing his bit to drive volatility in the market, which has for some reason gone against the USD.
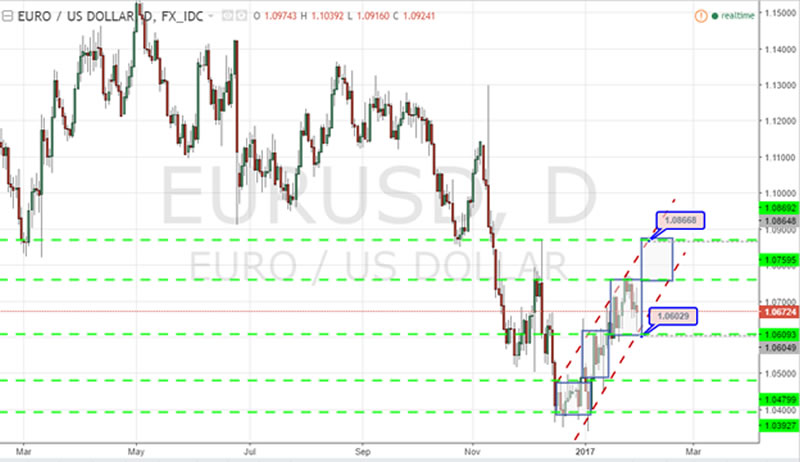
The daily chart above shows that the EUR/USD pair just hit a potential rebound zone after the most recent pullback.
The general outlook seems to point towards a continuation of an upward trending movement, and as demonstrated in the chart, if the rebound takes place it could rally the EUR/USD pair to 1.0860 level, which again is within the initial take profit zone suggested by the 4-hour chart.
So, does that make the trade worth taking or should traders expand the horizon further? Let’s look at the weekly chart to see if the picture remains the same.
In the first three charts, the bullish movement was created within the short-term breakouts and rebounds in a generally upward trending marker. However, the picture changes slightly when we expand the horizon further to the weekly and monthly charts.
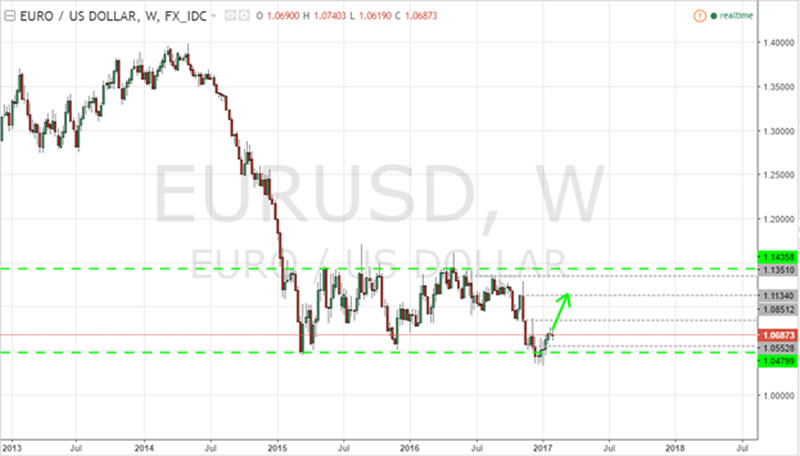
In the weekly chart above, the EUR/USD currency pair has been on a sideways movement since the year 2015. There have been a series of pullbacks and rebounds within a well-established support and resistance zone. And at the moment, the market seems to be on the rebound moving upwards towards the 1.085 level and potentially to the 1.1134 zone.
The monthly chart also seems to confirm this movement albeit in more squeezed version. The EUR/USD pair is currently trading within a bullish candle, which confirms the upward looking rebound in the weekly chart.
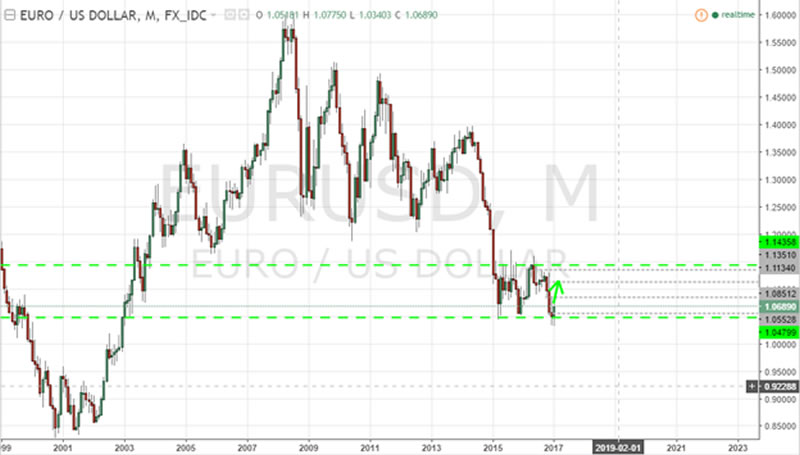
Therefore, this confirms the potentially bullish position that exists in the EUR/USD currency pair, both in the short-term and the long-term trading horizons, of course barring other market moving events tinkering the market.
Conclusion
In summary, trading a choppy forex market can be very tricky for all traders. However, as demonstrated in the example above, we can always look at it from different timeframes to spot opportunities that hide in plain sight.
The EUR/USD pair looks set for a bullish opportunity, but then again, a major news event could change everything.
By Nicholas Kitonyi
Copyright © 2017 Nicholas Kitonyi - All Rights Reserved Disclaimer: The above is a matter of opinion provided for general information purposes only and is not intended as investment advice. Information and analysis above are derived from sources and utilising methods believed to be reliable, but we cannot accept responsibility for any losses you may incur as a result of this analysis. Individuals should consult with their personal financial advisors.
© 2005-2022 http://www.MarketOracle.co.uk - The Market Oracle is a FREE Daily Financial Markets Analysis & Forecasting online publication.


