


Stock Market VIX Cycles set to Explode in March/April 2017 – Part 2
Stock-Markets / Stock Market 2017 Feb 13, 2017 - 03:29 PM GMTBy: Chris_Vermeulen

 Previously, I authored a “Part 1” of this article regarding my analysis of the VIX cycles. I sincerely hope my readers enjoyed the analysis and I hope it opened up a few questions regarding the potential moves in the US and global markets. Today, we will delve deeper into the concept of the VIX cycle patterns that I’ve identified and use common technical analysis concepts to attempt to identify price target levels as well as support and resistance that may become important in the immediate future.
For those of you that missed “VIX Cycles set to explode in March/April 2017 – Part 1”, please click on this link to review my earlier analysis. When you are ready, the rest of this article continues my analysis.
As we had been discussing in “Part 1”, my hypothesis that a 5 month VIX cycle pattern exists and has been driving market volatility since 2015 appears to be substantiated by historical chart evidence. The other interesting facet of this 5 month pattern is that it appears to be quickening in relation to recent activity. I stated earlier that I believe this pattern to be a 18~22 week cycle event, but more recent VIX chart activity shows the current range may be more like 16~20 weeks. My understanding of cycles and patterns is that within extreme, potentially violently, volatile periods, price cycles may become more frequent and velocity may become more volatile. An example of this can be found in my long-term US major market cycle analysis below.
This image maps a major market cycle rotation process that has been in place for over 60 years. This image starts in the late 1970s and maps TOP and BOTTOM cycling events and well as potential early and late stage cycle ranges. When the GREEN and YELLOW levels, near the top, move above the 80% range, this starts the “Topping cycle event”. When both of these levels fall below the 80% range, this ends the “Topping cycle event”. The opposite is true for the BLUE and RED levels. When both of them fall below the 20% level, this starts a “Bottoming cycle event”. When they both leave the 20% level, this ends the “Bottoming cycle event”. Actual price tops and bottoms can, and often do, occur within these event ranges.
US Cycle Chart
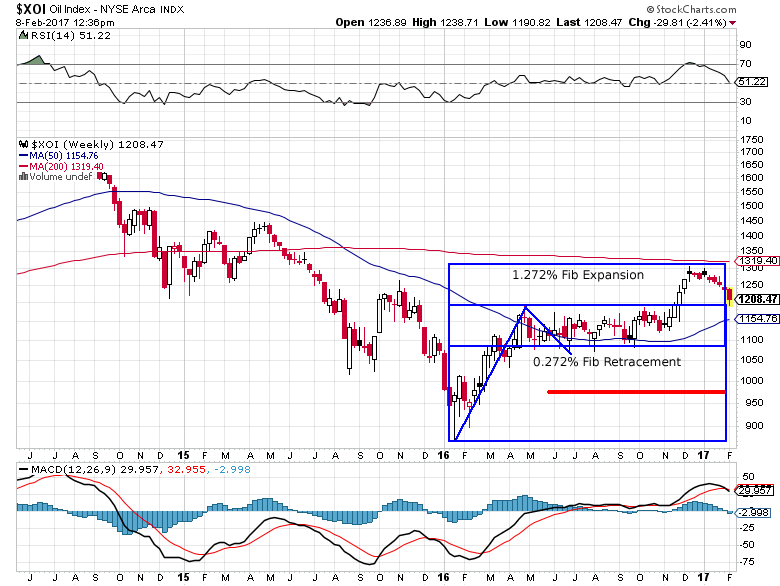
Price and event cycles have been in place for centuries and correlate with other traditional forms of technical analysis easily. For example, Elliot Wave, Fibonacci, Price Channeling and Price Patterns all relate to cycles very well. Within this article, I’m using Price Patterns as well as Fibonacci to attempt to project and identify key target, support and resistance levels based on my understanding of the proposed VIX cycles.
Recent price expansion from the lows at $868.47, January 2016, prompted a rally to $1194.60, on April 25, 2016. This range, $326.13, represents an expansion cycle and a Fibonacci range that we can use to determine Fibonacci cycle frequency – which may help us determine future price objectives. After this peak, price dropped 25% of this range (a common Fibonacci level that is correlated to a real Fib value of 0.272) equaling $81.53. Because of this narrow retracement, we should expect a potential future price move equaling 1.272%, 1.618% or 1.768% of the existing range. XOI rallied to $1259.56 on December 12, 2016 – equating the expected 1.272% price expansion we projected and setting up for a 0.768% total range retracement.
Let’s take a look at one example – OIL (XOI)
Last week followers, subscribers and I got long 3x long energy fund – ERX.
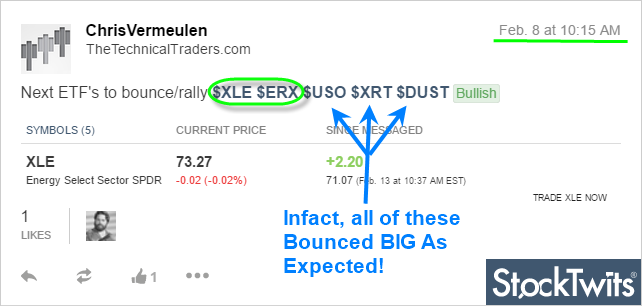
In 24 hours we locked in a 7.7% partial profit, and are now sitting with 10+% gain on the balance. This special setup I call the Momentum Reversal Method (MRM) continues to be in play and we could experience another 20-35% gain from here.
What does all this technical stuff mean? After this bounce we should expect XOI to fall back to near $976.00 before attempting any further price moves. All of this type of Fibonacci work is conducted by understanding how Fibonacci price relationships correlate to time/price/cycle frequency functions. Many of the best analysts of the past had detailed understandings of how these correlations work and how price would react based on larger and longer term time/price/cycle events.
Stay Tuned For Gold & Silver Forecast Next – Part 3
And Join My Newsletter for Real-Time Trade Alerts!
Chris Vermeulen
Chris Vermeulen is Founder of the popular trading site TheGoldAndOilGuy.com. There he shares his highly successful, low-risk trading method. For 7 years Chris has been a leader in teaching others to skillfully trade in gold, oil, and silver in both bull and bear markets. Subscribers to his service depend on Chris' uniquely consistent investment opportunities that carry exceptionally low risk and high return.
Disclaimer: Nothing in this report should be construed as a solicitation to buy or sell any securities mentioned. Technical Traders Ltd., its owners and the author of this report are not registered broker-dealers or financial advisors. Before investing in any securities, you should consult with your financial advisor and a registered broker-dealer. Never make an investment based solely on what you read in an online or printed report, including this report, especially if the investment involves a small, thinly-traded company that isn’t well known. Technical Traders Ltd. and the author of this report has been paid by Cardiff Energy Corp. In addition, the author owns shares of Cardiff Energy Corp. and would also benefit from volume and price appreciation of its stock. The information provided here within should not be construed as a financial analysis but rather as an advertisement. The author’s views and opinions regarding the companies featured in reports are his own views and are based on information that he has researched independently and has received, which the author assumes to be reliable. Technical Traders Ltd. and the author of this report do not guarantee the accuracy, completeness, or usefulness of any content of this report, nor its fitness for any particular purpose. Lastly, the author does not guarantee that any of the companies mentioned in the reports will perform as expected, and any comparisons made to other companies may not be valid or come into effect.
Chris Vermeulen Archive |
© 2005-2022 http://www.MarketOracle.co.uk - The Market Oracle is a FREE Daily Financial Markets Analysis & Forecasting online publication.