


Gold, Silver, US Dollar Cycles
Commodities / Gold and Silver 2017 Feb 17, 2017 - 07:04 PM GMTBy: Chris_Vermeulen

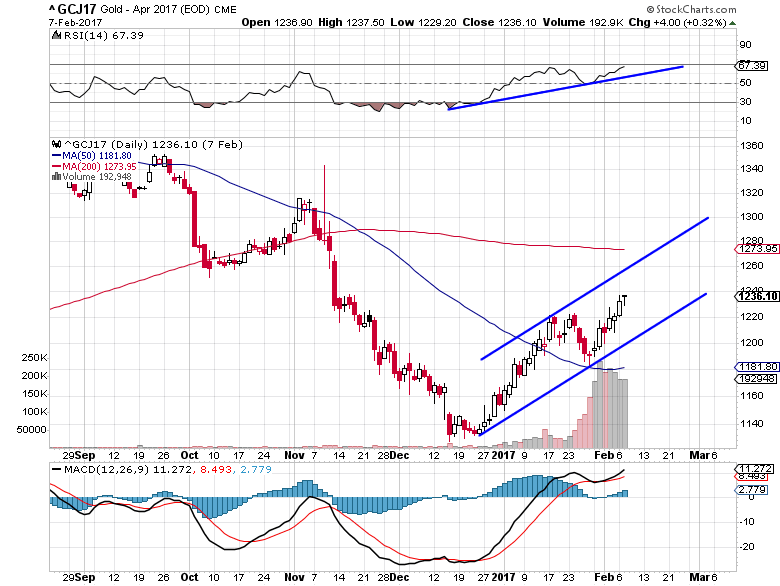
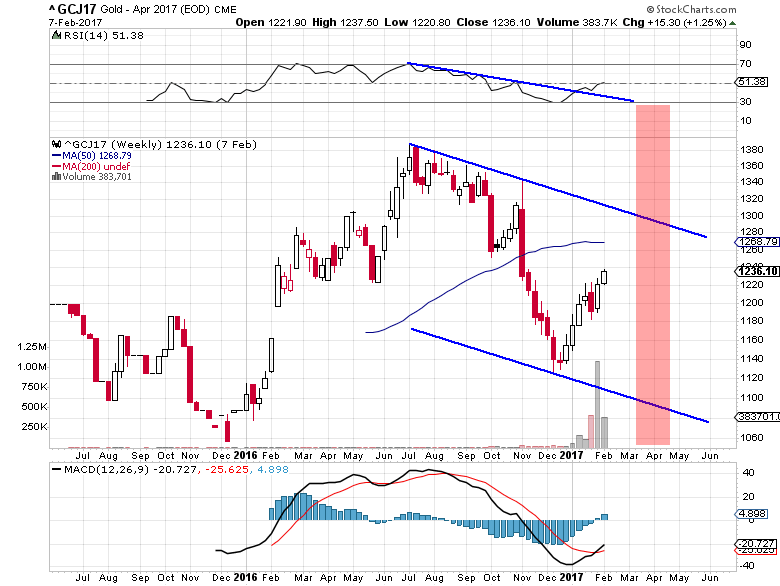
 Gold is setting up for a historic rally based on my analysis. Recent news provides further evidence that the Precious Metals and Currencies are in for a wild ride. Just this week, news that China’s reserves fell below $3 Trillion as well as the implications that the fall to near $2T in reserves could happen before the end of 2017. Additionally, we have recent news that the EU may be under further strain with regards to Greece, the IMF and debt. The accumulation of Precious Metals should be on everyone’s mind as well as the potential for a breakout rally.
Based on my analysis, I would estimate that near June or July 2017, Gold will be near $1315 ~ $1341 (+13% from recent lows). This level correlates to a Fibonacci frequency that has been in place for over 3 years now. A second Fibonacci frequency rate would put the project advancement levels, possibly closer to October/November 2017, near $1421 (+21% from recent lows). After these levels are reached, I expect a pullback to near $1261 if the Gold rally ends near $1315~1341 or to near $1308~1309 if the Gold rally ends near $1421. This pullback would setup a massive next wave rally to $1585 or $1731. So, if you need confirmation of this move, just wait for any rally to end above $1315, then wait for a pullback below $1280 or $1315 and BUY.
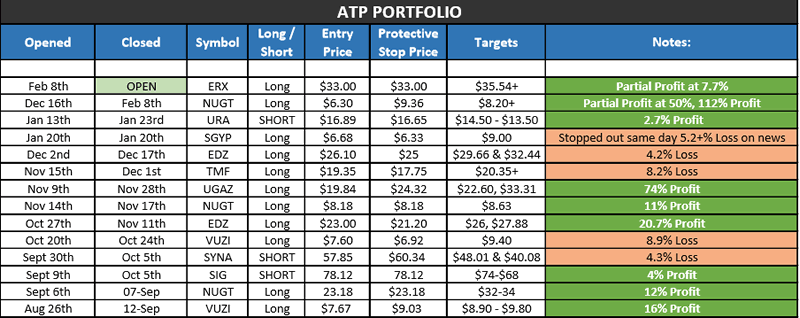
Subscribers and followers of my work profited handsomely this month locking a 112% profit with NUGT ETF with my service at ActiveTradingPartners.
Remember, the volatility expansion I am expecting in the VIX near March/April will likely be the precursor event to a much larger volatility expansion later this year. I can’t accurately detail the scale and scope of the projected March/April event other than it will likely be larger than the last VIX expansion. I expect these global debt events to unravel the low volatility activity we have been seeing and shake up global markets/currencies. Within this process, Precious Metals will likely see a massive upside run as a protection from uncertainty and risk.
Silver Rally
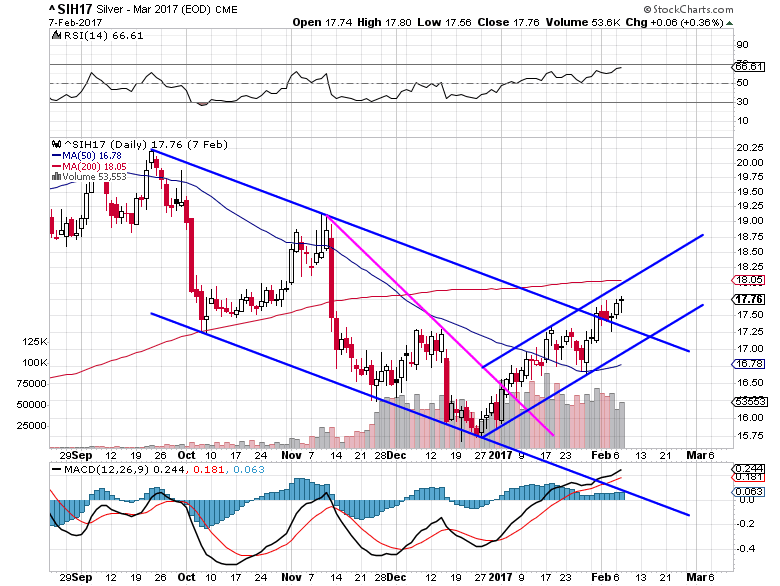
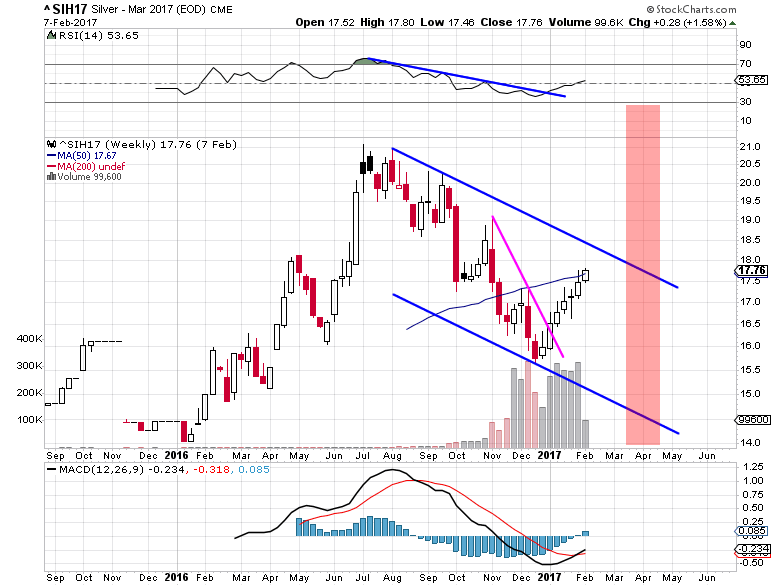
Much like Gold, the other shiny metal is set for incredible runs as well. Given my Fibonacci frequency analysis, a similar type of patter may occur in Silver. Before we get too much further into this analysis, let me be clear about one thing. We are already nearly +50% towards the upside rally target in Silver based on simple Fibonacci frequency. This target is $19.10. This does not mean this is the end of the run (yet). It means we have already achieved some success in one level of predictive analysis and now we need to see if the second Fibonacci frequency plays out. The second Fibonacci frequency target is $20.78 (nearly +25% from recent lows)
Much like the Gold analysis, after these levels are reached, I expect a retracement/pullback to levels that reflect the Fibonacci frequencies before a follow through rally continues. The first Fibonacci frequency pullback range is $18.26~$17.85. The second, larger, Fibonacci frequency pullback range is $19.50~$18.82. Case in point, these retracement levels are based on what I can determine as common Fibonacci frequencies. The pullbacks could be deeper and reflect more uncommon frequency functions. As of right now, I don’t believe that will be the case – but I could be wrong on this matter. In any event, once the rally points ($19.10 or $20.78) are reached and Silver pulls back to below my retracement objectives ($18.26~$17.85 or $19.50~$18.82 respectively), look for long entry positions or accumulate more physical metals. Want to know what my upside “second wave” objective might be based on my frequency analysis for Silver?
Silver Charts – Daily & Weekly
Seeing as though you have been so patient in reading my analysis/article regarding these VIX cycle patterns and what I believe could happen with the US and global markets, I’m going to shed a little light into the future cycle phases of Silver. We’ll focus on Silver for one reason, it is a cheaper precious metal for most traders to participate in and it has some very interesting facets of cycle/Fibonacci analysis. One key date range that keeps appearing in my cycle analysis is April 17th through April 24th.
Additionally, June 26, July 31 and August 14 appear to be key cycle dates. Given my earlier analysis, I suspect the April dates will be critical to the VIX cycle spike that I’m expecting. It could also drive further expansion or price rotation in the Gold, Silver and OIL charts. What is interesting about these Fibonacci Time/Price “inflection points” is that they can be drivers of many outcomes (rallies, collapses, rotations, tops or bottoms). They simply tell us that we need to be aware of these dates and they may, and will likely, present key information for future decision making.
Now, onto the extended projections for Silver. If my first, shorter, Fibonacci frequency is correct, any subsequent (second wave) rally will likely start near $17.85~$18.15 sometime near or after April 10, 2017. This second phase rally will likely run to near $21.46 before finding resistance (possibly slightly higher). Target objective date ranges for this rally to end are June 19 through July 24.
If my second, longer/larger, Fibonacci frequency analysis is correct, any subsequent (second wave) rally will likely start near $18.80 sometime near or after May 8, 2017 and run to near $24.85 before finding resistance (possibly higher). Target objective date ranges for this rally to end are July 3 through August 7 (or later).
Remember, these second wave projections in Silver represent a 20.5% and 32.85% rally from my projected retracement levels. These are massive moves and I hope you are all able to take advantage of these triggers. Gold should move in somewhat similar manners – so pay attention. Smart traders and followers of ATP newsletter may take advantage of trades to play these moves.
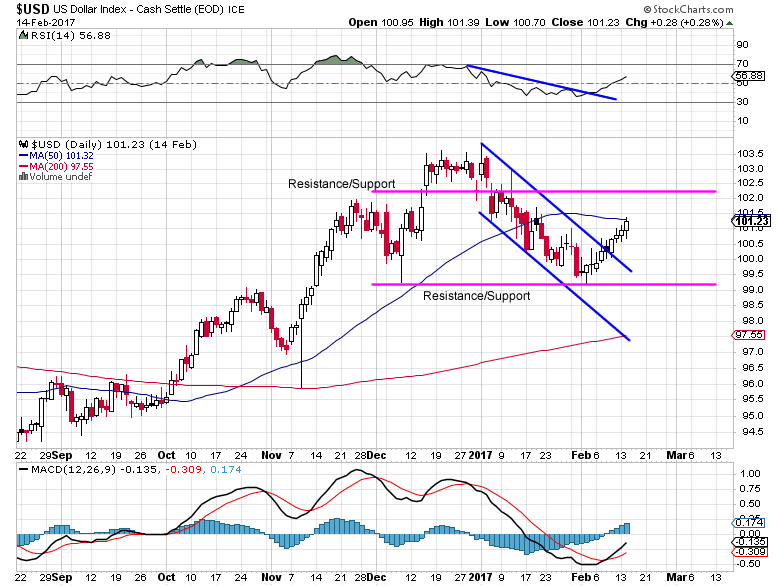
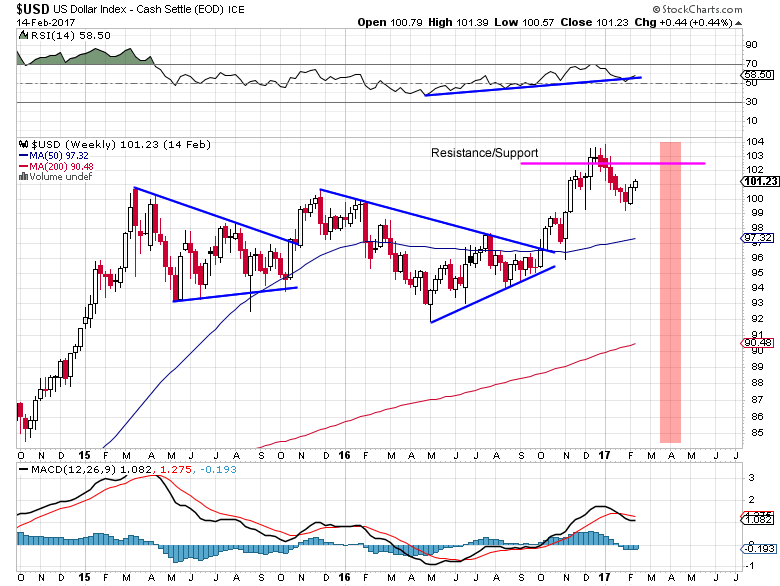
USD (US Dollar) and Foreign Currencies
I touched on this topic earlier, yet I feel the need to provide further documentation regarding my belief that the USD will continue to enjoy renewed strength at least for the next few months. First, I expect the global weakness in foreign markets to continue to propel the USD and the US stock market to greater attempts at new highs. I believe large amounts of money will keep pouring into the US markets for reasons that are obvious to most – US strength and capabilities for growth. As I often tell my clients, if the US is growing, so is the rest of the world. The current situation is a bit different though as the US markets and currency is, as I believe, going to be a standout marketplace in a global pot of debt and confusion.
There is one level of resistance on the USD that we have to be concerned with, the $102.25 level. Beyond that, I believe the USD could reach $104~105 before August 2017. The possibility that a VIX expansion could drive the USD higher would be more highly correlated if there is some external (global) event that provides a catalyst for a stronger US Dollar. For example, a crisis in Europe, Greece or Asia that undermines expected currency valuations and results in strength in the USD. Right now, I would put that possibility at about 50/50 given some of the news items I’m seeing and the continued fundamental strength of the US economy.
USD Daily & Weekly Charts
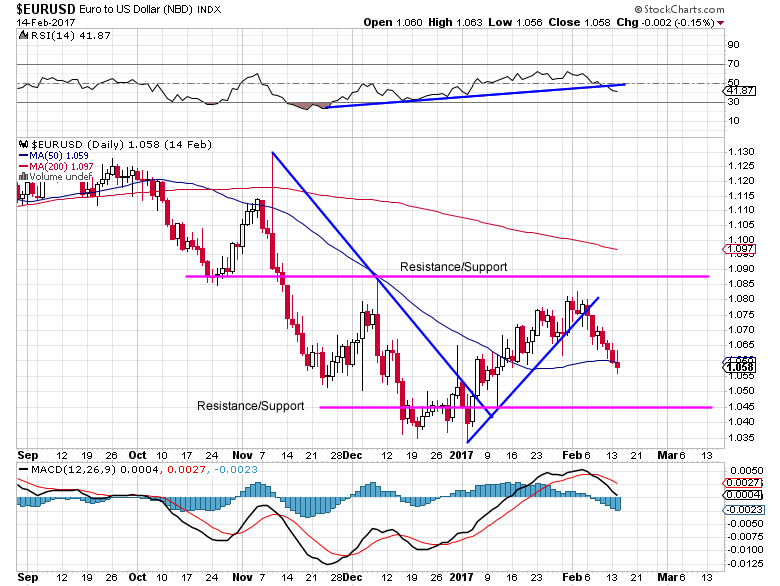
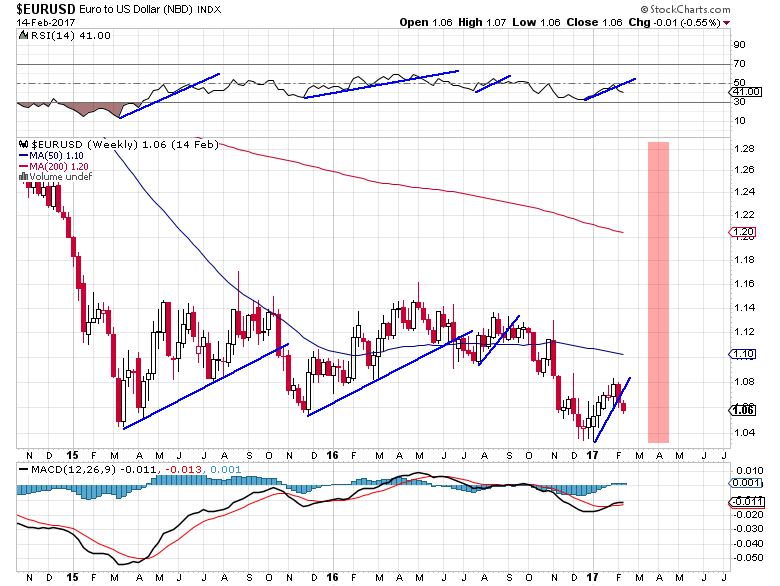
The EURUSD relationship will continue to see downward pressure with a likely target objective near 1.035 as a first target. This downward pressure could drive the EURUSD valuations well below this level, but I feel the potential for the EURUSD falling below the 1.00 level is still far off. It would take a global cataclysmic event to drive the EURUSD values below PAR. I’m not saying it could happen, but I am saying I don’t see it happening anytime soon (without a global cataclysmic event).
My Fibonacci frequency target levels for the EURUSD are 1.014 and 0.999. As I stated, I don’t believe there is much downside risk below 0.99 unless the EU completely collapses. I still feel the Euro will survive as a global currency near PAR with the USD.
EURUSD Daily & Weekly Charts
Take a look at some of my recent trades to see how we’ve been able to generate profits for our valued members.
I hope you have enjoyed my analysis of the VIX cycle patterns and how the relate to opportunities for all traders? If you find this type of analysis helpful and want to take advantage of clear, concise and profitable trading signals, visit ActiveTradingPartners.com where I share even more detailed analysis and trading triggers with my members.
John Winston
Co-Author: Chris Vermeulen
www.ActiveTradingPartners.com
Chris Vermeulen
Chris Vermeulen is Founder of the popular trading site TheGoldAndOilGuy.com. There he shares his highly successful, low-risk trading method. For 7 years Chris has been a leader in teaching others to skillfully trade in gold, oil, and silver in both bull and bear markets. Subscribers to his service depend on Chris' uniquely consistent investment opportunities that carry exceptionally low risk and high return.
Disclaimer: Nothing in this report should be construed as a solicitation to buy or sell any securities mentioned. Technical Traders Ltd., its owners and the author of this report are not registered broker-dealers or financial advisors. Before investing in any securities, you should consult with your financial advisor and a registered broker-dealer. Never make an investment based solely on what you read in an online or printed report, including this report, especially if the investment involves a small, thinly-traded company that isn’t well known. Technical Traders Ltd. and the author of this report has been paid by Cardiff Energy Corp. In addition, the author owns shares of Cardiff Energy Corp. and would also benefit from volume and price appreciation of its stock. The information provided here within should not be construed as a financial analysis but rather as an advertisement. The author’s views and opinions regarding the companies featured in reports are his own views and are based on information that he has researched independently and has received, which the author assumes to be reliable. Technical Traders Ltd. and the author of this report do not guarantee the accuracy, completeness, or usefulness of any content of this report, nor its fitness for any particular purpose. Lastly, the author does not guarantee that any of the companies mentioned in the reports will perform as expected, and any comparisons made to other companies may not be valid or come into effect.
Chris Vermeulen Archive |
© 2005-2022 http://www.MarketOracle.co.uk - The Market Oracle is a FREE Daily Financial Markets Analysis & Forecasting online publication.