


Gold: Short End US Rates Matter More Than Long End Real Yields
Commodities / Gold and Silver 2017 Feb 22, 2017 - 10:14 AM GMTBy: Bob_Kirtley

 In the years following the GFC, short end yields in the US were contained for an extended period of time as the Fed committed to keeping rates on hold. Given the static nature of the short end, and the shift of monetary policy implications further out the curve through QE programs, long end US rates became the focus. When discussing the drivers of gold prices, long end US real rates (the yield on inflation protected bonds) was the critical factor. However over the past couple of years, the Fed has hiked rates twice, and we now have live meetings with an active short end. This has reduced the impact of long end real rates on gold, and instead shifted the focus to the short end. We now form our view on gold prices overwhelming based on short end rates, as opposed to long end yields. Our bearish view on gold prices is derived from a Fed hike in June.
The Historical Correlation
Looking back at the relationship between gold prices and US real rates there is a solid case. We wrote about it at length through 2010-2012 ( The Key Relationship between US Real Rates and Gold Prices) and specifically how it replaced the typical inverse relationship between the USD and gold that had been observed in the past. We will use simple regressions from GLD, the gold ETF and TIP, an ETF that tracks the performance of TIPS – Treasury Inflation Protected Securities – in effect real yields. Over a long term time frame the regression appears solid, with an R-squared value of 0.7742 – meaning that 77.42% of the changes in the GLD price can be statistically explained by the change in TIP.
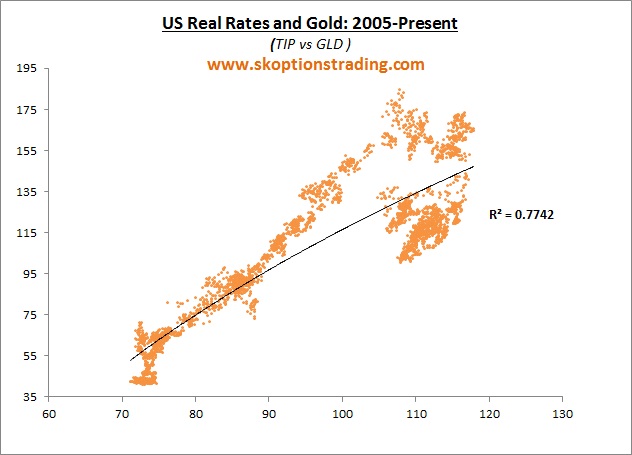
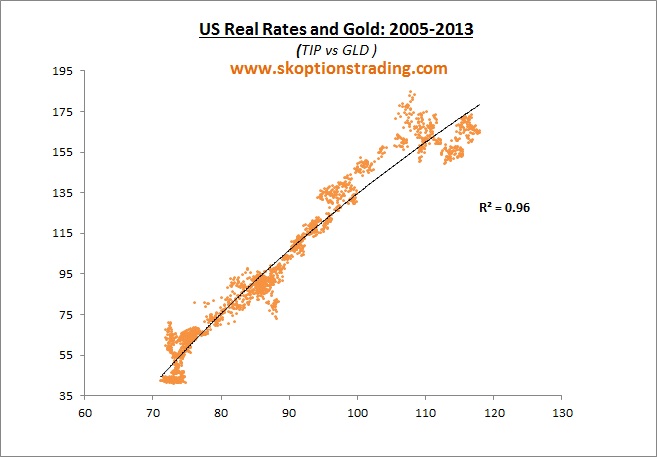
Readers will notice a “clump” of data that skews the regression line from what would be a very strong relationship. This strong relationship was particularly evident through to about 2013. Up until this point the world was very focused on QE and the short end rate mattered little as the Fed was on hold for the foreseeable future. Hence, gold and other assets were very closely related to the longer term real rates, since both the long end rates and gold were impacted in a similar manner by changes to QE programs.Before the Fed started to taper QE and discuss rate hikes, US real rates and gold moved in tandem. The below chart, that excludes data from 2013 and later, shows that 96% of the changes in GLD can be statically explained by changes in TIP. We discussed this at length, particularly in 2011 when the collapse in US real yields saw us take aggressive long positions in gold targeting a rally to $1800.
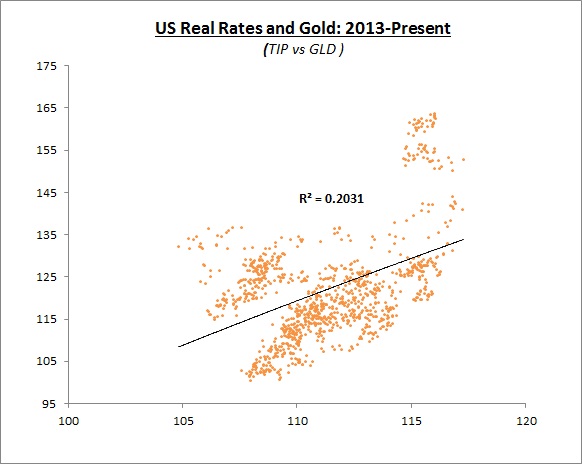
Then we had the “taper tantrum” as the Fed stopped adding to QE. The Fed also then began talking about raising short term rates at some stage, and it was during this period that the relationship between gold and US real rates collapsed.
Shifting to the Short End
The market’s focus shifted from the long end of the curve to the short end. Gold was suddenly being driven by rate hike expectations, not QE expectations. This has remained the case until today. From the start of 2013, just over 20% of the moves in GLD can be explained by moves in TIP. This is a huge drop from the 96% we observed 2005-2013.
After being dormant for so many years, the short end of the US yield curve is now very much active. We have had two hikes in the last 26 months and we have 2-3 more priced into the next 12mths. That means that the short end is now the key driver of gold prices, taking the place of US real rates in the longer end.
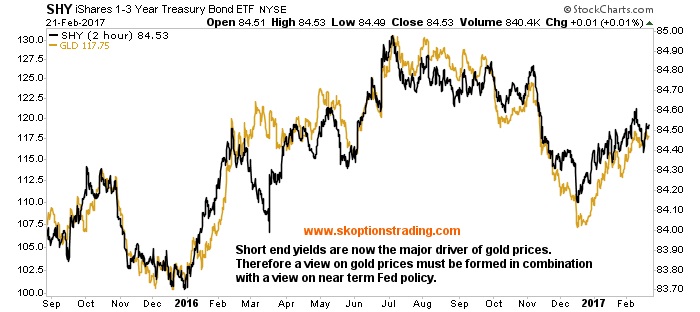
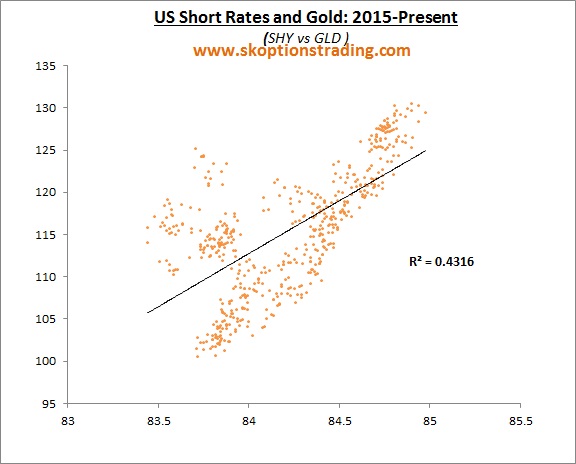
Looking at the relationship between SHY (an ETF that holds 1-3y Treasury Bonds) and GLD we can see that since the start of 2015 it exhibits a modestly strong 0.43 R-Squared value with GLD.
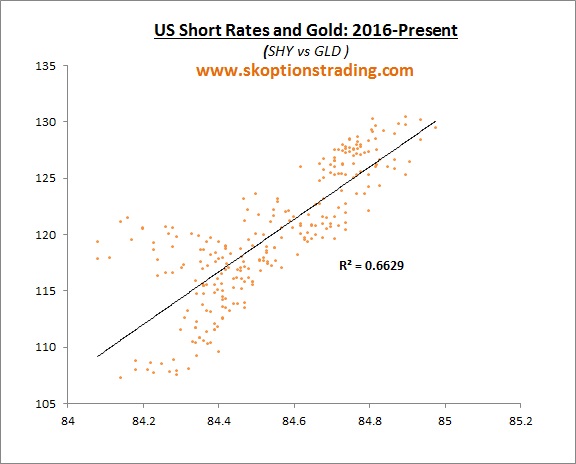
However what is more important is that this relationship is strengthening. With the Fed on a tightening bias, and 2-3 hikes priced by the end of 2017, short end US yield are the key part of the US bond market to watch. Plotting the same pair from the start of 2016 shows an R-squared that’s increased from 0.43 to 0.66. Of course this is still well short of the 0.96 we saw between US real rates and gold at the peak of their relationship, but nonetheless still an important trend to note. The relationship between US real rates and gold prices has significantly decreased, whilst the relationship between US short end rates and gold prices is steadily increasing.
If the Fed delivers more hikes this year, we could see further weakness in US short end bonds and therefore in gold prices. If Yellen does not come through with hikes, then short end US yields will fall, sending gold higher.
Trading the New Relationship
It is our core view that the Fed will not hike in March, but wait until June. Whilst gold prices are enjoying some temporary support from contained short end yields (with a March hike unlikely), once we move closer to June, and a hike becomes more likely, this will send US short end yields higher and therefore drag gold prices lower.
In the three months prior to the last two hikes, gold prices fell 10-15%. Using that as a rough guide, we see gold falling to between $1125-$1050 over the next few months. If US data improves, and the Fed delivered further rate increases in September and/or December, we will likely see another leg lower in gold through the major support zone around $1050.
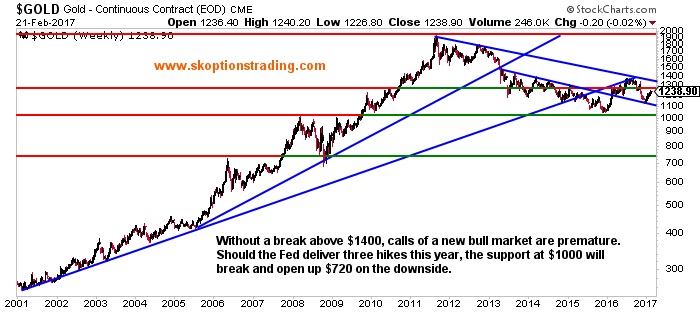
Below $1050, there is not a lot of support until $720, which is why we view the risks as asymmetric in gold at present, and our biased to run short positions on the yellow metal. Our core view is not for three hikes this year. Our core view is a hike in June and a 50% chance of another hike before the end of the year. However it would take no hikes at all this year to really push gold into a new bull market through $1400. One hike in June will see gold re-test the lows. From there it does get very vulnerable from a technical and fundamental standpoint to the downside.We are not perma-bears not perma-bulls on gold. We are simply a trading operation and therefore try not to be perma-anything. We trade gold from a macro view point, and at present we view the macro landscape as supportive of a June hike and possibly another later in the year. Given the current level of gold prices, plus the risk-reward in various long term option strategies we have discussed with our subscribers, we are bearish on gold at this point.
Our plan is to layer into a number of short positions over the coming month or two, having a substantial short position well before the June FOMC. To see what trades we are executing please subscribe via either of the buttons below. Regardless of one’s view on gold, the purpose of this article was to highlight the growing importance of short end yields in determining the gold price. At the same time, the importance of long end real yields is diminishing. Staying focused on the Fed, and building a view on gold from that, continues to be the optimal way to trade gold from a macro standpoint.
Go Gently
Take care.
Bob Kirtley
Email:bob@gold-prices.biz
www.gold-prices.biz
URL: www.skoptionstrading.com
To stay updated on our market commentary, which gold stocks we are buying and why, please subscribe to The Gold Prices Newsletter, completely FREE of charge. Simply click here and enter your email address. Winners of the GoldDrivers Stock Picking Competition 200
DISCLAIMER : Gold Prices makes no guarantee or warranty on the accuracy or completeness of the data provided on this site. Nothing contained herein is intended or shall be deemed to be investment advice, implied or otherwise. This website represents our views and nothing more than that. Always consult your registered advisor to assist you with your investments. We accept no liability for any loss arising from the use of the data contained on this website. We may or may not hold a position in these securities at any given time and reserve the right to buy and sell as we think fit.
Bob Kirtley Archive |
© 2005-2022 http://www.MarketOracle.co.uk - The Market Oracle is a FREE Daily Financial Markets Analysis & Forecasting online publication.