Gold Stocks Enormous Daily Slide
Commodities / Gold and Silver Stocks 2017 Feb 28, 2017 - 06:42 PM GMTBy: P_Radomski_CFA
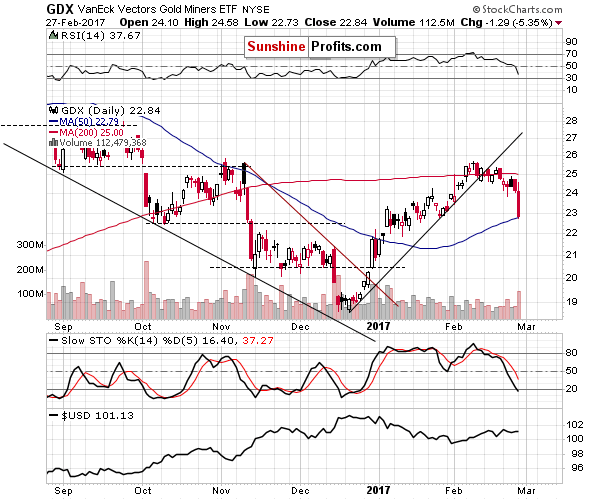
 Yesterday was just another period of back-and-forth movement for gold, silver, the USD Index and even the general stock market – but not for precious metals mining stocks. Gold stocks and silver stocks plunged very visibly - there are very important implications of this move and they are not bullish.
Let’s take a closer look at the charts (charts courtesy of http://stockcharts.com), starting with the GDX ETF (proxy for both gold and silver stocks).

Precious metals mining stocks declined on huge volume and the fact that this happened without the metals’ lead is profound. Miners were a leading indicator in the recent past as well as in the previous years – including the time before THE plunge of 2013. We discussed that in greater detail in yesterday’s gold trading alert, while describing the situation in gold stocks (using the HUI Index as a proxy):

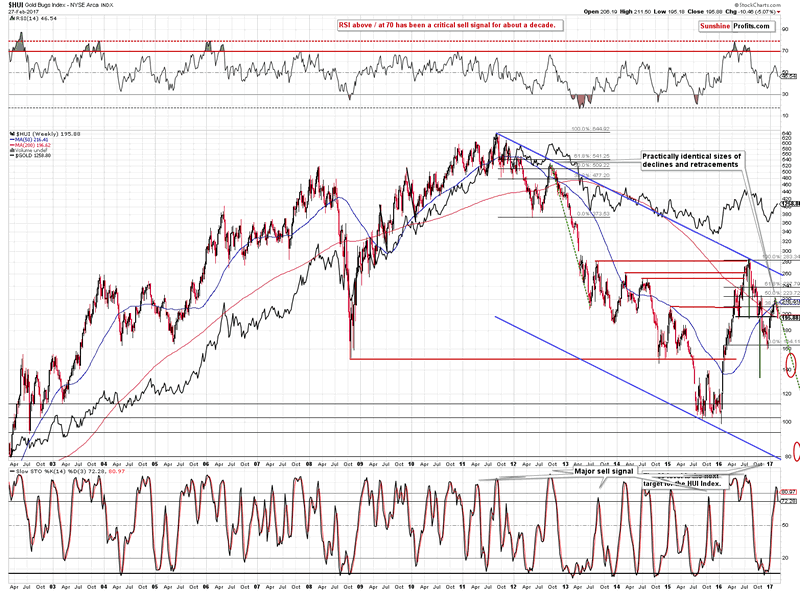
The HUI Index declined by 8 index points (almost 4%) [last week] despite having very strong reasons to move higher. Not only gold rallied, but we also saw higher prices of stocks in general (highest weekly close ever in case of S&P and DJIA) – miners should have rallied strongly and they weren’t just responding weakly – they declined, which is rather extreme. We saw something similar in 2012 and 2013, before the huge plunge in gold.
The above chart features something less visible but still very important. The size of the decline that followed the 2011 top and the size of the subsequent rebound (in the second half of 2012) is practically identical to the decline that we saw in the second half of 2016 and the current rebound. Back in 2012 gold stocks formed a local top after retracing about 50% of the previous decline and it appears that exactly the same thing happened also this time.
But the question remains if the top in metals was just formed or not. The upswing in gold and volume in GLD makes it quite likely.
Interestingly, while the HUI declined by almost 4% last week, it’s already down by more than 5% this week, even though gold is flat. The bearish implications described above clearly remain in place.
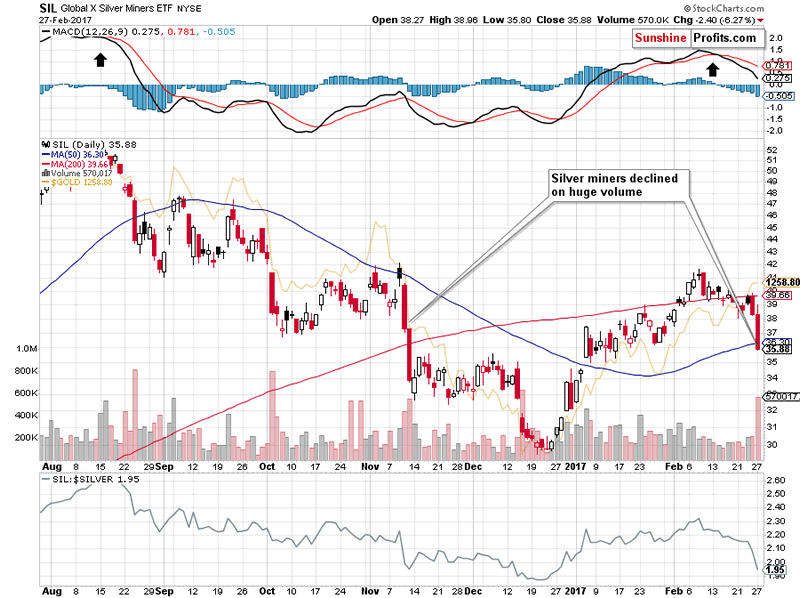
We already featured the GDX ETF chart that includes silver stocks, but let’s take a look specifically at them, to make sure that they confirm the observations made while analyzing gold stocks.

During yesterday’s session alone silver stocks declined about as much as they did from the February top to Friday – the size of the decline just doubled. The volume was huge. Both factors (size and volume) serve as good confirmations of the bearish signals that we discussed earlier.
Summing up, the bearish outlook for the precious metals sector remains in place. While the daily price changes are not particularly meaningful (except the miners’ underperformance – its implications are meaningful and bearish), the long- and medium-term signals that are very important (being highly effective in the past) continue to paint a very bearish picture for the precious metals sector for the upcoming weeks and months. It seems that the following weeks will be more than exciting and we encourage you to stay up-to-date with developments in gold and silver. Good way to start is to sign up for our daily gold & silver mailing list – it’s free and if you don’t like it, you can easily unsubscribe – sign up today.
Thank you.
Sincerely,
Przemyslaw Radomski, CFA
Founder, Editor-in-chief
Tools for Effective Gold & Silver Investments - SunshineProfits.com
Tools für Effektives Gold- und Silber-Investment - SunshineProfits.DE
* * * * *
About Sunshine Profits
Sunshine Profits enables anyone to forecast market changes with a level of accuracy that was once only available to closed-door institutions. It provides free trial access to its best investment tools (including lists of best gold stocks and best silver stocks), proprietary gold & silver indicators, buy & sell signals, weekly newsletter, and more. Seeing is believing.
Disclaimer
All essays, research and information found above represent analyses and opinions of Przemyslaw Radomski, CFA and Sunshine Profits' associates only. As such, it may prove wrong and be a subject to change without notice. Opinions and analyses were based on data available to authors of respective essays at the time of writing. Although the information provided above is based on careful research and sources that are believed to be accurate, Przemyslaw Radomski, CFA and his associates do not guarantee the accuracy or thoroughness of the data or information reported. The opinions published above are neither an offer nor a recommendation to purchase or sell any securities. Mr. Radomski is not a Registered Securities Advisor. By reading Przemyslaw Radomski's, CFA reports you fully agree that he will not be held responsible or liable for any decisions you make regarding any information provided in these reports. Investing, trading and speculation in any financial markets may involve high risk of loss. Przemyslaw Radomski, CFA, Sunshine Profits' employees and affiliates as well as members of their families may have a short or long position in any securities, including those mentioned in any of the reports or essays, and may make additional purchases and/or sales of those securities without notice.
Przemyslaw Radomski Archive |
© 2005-2022 http://www.MarketOracle.co.uk - The Market Oracle is a FREE Daily Financial Markets Analysis & Forecasting online publication.


