Stock Market Bubble and Gold
Stock-Markets / Stock Market 2017 Mar 24, 2017 - 03:07 PM GMTBy: Arkadiusz_Sieron
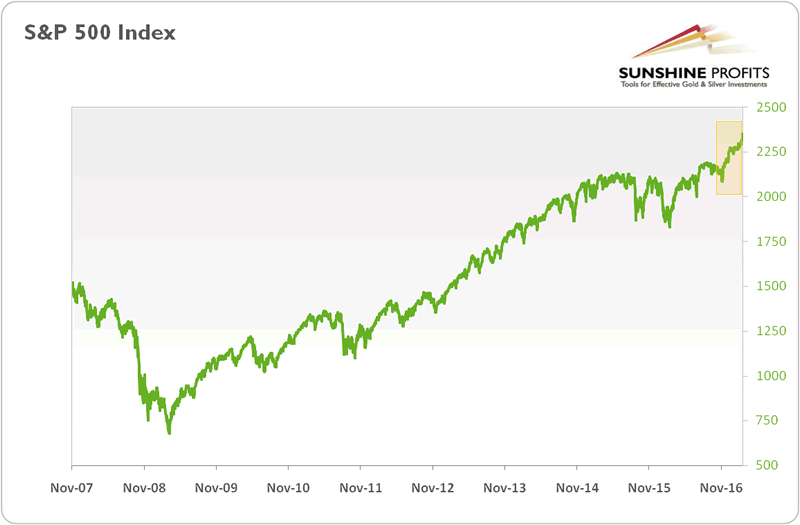
 In January, the Dow Jones Industrial Average broke above the symbolic 20,000 for the first time ever. This development raised again concerns about the condition of the U.S. stock market - further gains could be a headwind for the gold market, but the end of the bull market would support the yellow metal. The valuations were at record highs even before the presidential elections, but Trump's rally elevated them further, as the chart below shows.
Chart 1: S&P 500 Index from November 2007 to February 2017.

Does it mean that there is a bubble in the stock market? If yes, is it going to burst in the near future? (Perhaps due to the Fed's tightening cycle?) Let's analyze whether the U.S. equities are in bubble territory and draw conclusions for the gold market.
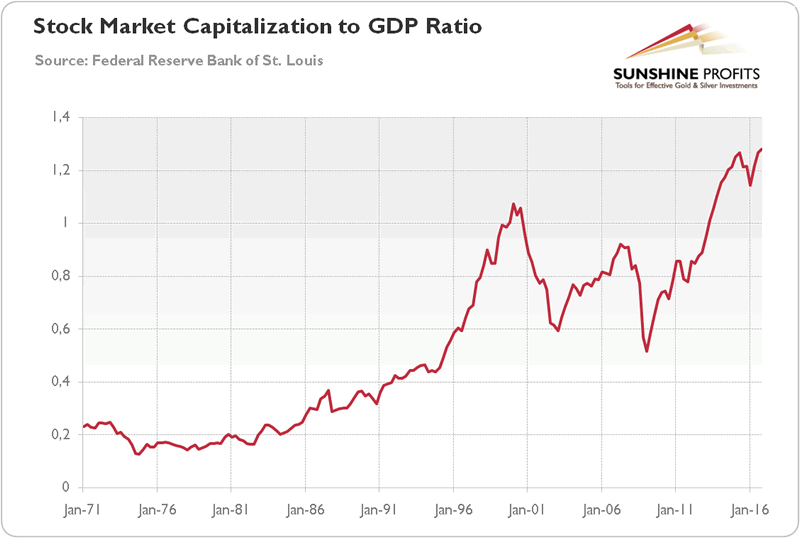
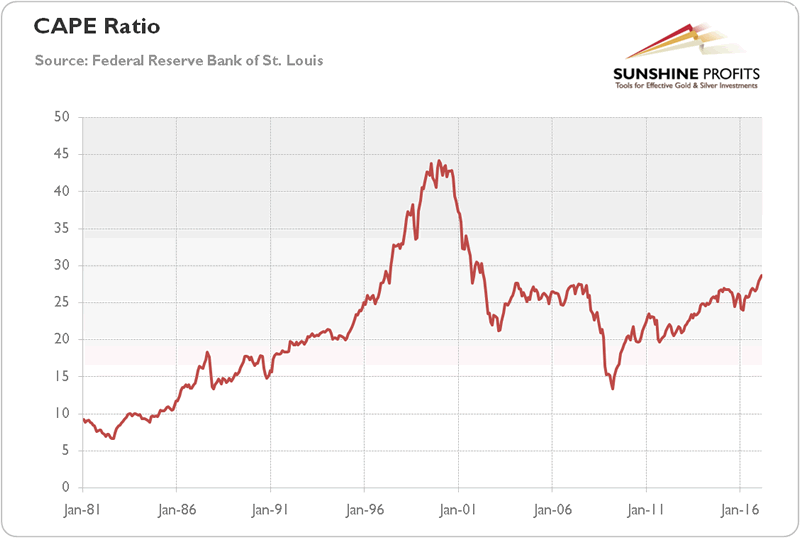
Surely, when we look at the Buffet Indicator, i.e. the ratio of market capitalization to GDP, or at the Cyclically Adjusted Price Earnings Ratio - the Robert Shiller's market valuation estimate - stocks do not look cheap. The Wilshire 5000 Total Market Cap to GDP Ratio is at a historical high, while the S&P 500 stands at 28.66 times the corporate earnings of the past 10 years, as one can see in the charts below.
Chart 2: Stock Market Capitalization to GDP Ratio from 1971 to 2017

Chart 3: P/E from 1981 to 2017.

It means that equities are actually higher than before the 1929 crash or in 2007, the edge of the crisis. However, the valuation is still below the extreme level of the early 2000s (when we look at CAPE). Anyway, it is true that investors are probably overly optimistic about the Trump's presidency and its economic plans, but the problem is that the market can remain irrational for far longer than investors stay solvent. And as Chart 1 suggests, 2009-2014 looks like a consolidation rather than a bubble.
Moreover, we do not see a “this time it's different” mood in the market right now. There is no speculative fever among the wide population when even taxi drivers discuss stocks. Quite the opposite, the participation of Americans in the stock market has been on a downswing in recent years: 65 percent of adults reported investing in the stock market in 2007, while only 52 percent of them owned equities in 2016. Additionally, the recent market returns are what we would expect to happen after one of the worst bear markets in the history. The average annual return during the current boom market was 16.9 percent, while the eight-year periods following four comparable bear markets saw 17.2 percent in the annual average gain.
To be clear, we believe that the Fed's zero interest rate policy artificially boosted asset prices, however we do not see the level of irrational exuberance characteristic of previous financial bubbles. There are, of course, good reasons to worry: the current economic expansion and the bull market are into their eighth year, while the interest rates are increasing, which usually precedes a burst. However, expansions really do not die of old age - and the current long expansion may simply result from the slow pace of the recovery. It may be the case that the U.S. economy has been developing slower, but in a more sustainable way than in the roaring 2000s. Similarly, the bull stock market is quite old, but is it not the case that the equities are just the best option in the world of the low interest rates? What is also important is that all previous bubbles were driven by some particular sectors: tulips, railways, Internet stocks, real estates, etc. But where is the bubble coming from now? Or what is capturing investors' fancy now? Ok, there could be a fracking boom, but it ended, and the economy dealt with it. There are some risks connected with the subprime auto loans and student loans, but these concerns are not comparable to the subprime mortgages.
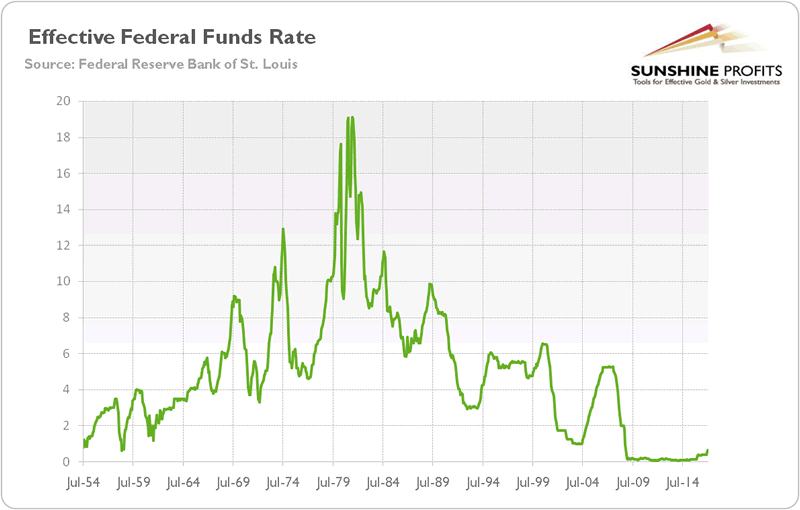
But is it not possible that the Fed interest rate hikes would end the bull market in equities? Well, it might happen, to be sure, as some investments undertaken when interest rates were basically zero may be no longer profitable at higher interest rates. However, we have two caveats. First, the current tightening cycle is unusually gradual and very well telegraphed to the markets - it softens the potentially negative impact on the financial markets. If you look at the chart below, you will get our point.
Chart 4: The effective federal funds rate from 1954 to 2017.

Second, the Fed started to tighten its monetary policy when the economy had already slowed down. It implies that the interest rate hikes may not spoil the party, since there is no party at all, at least when we look at the real economy. The stock market looks a bit elevated, but does not suggest a bubble.
What does this all mean for the gold market? Well, stocks may go down in the future and they eventually will, as bears always come after bulls. In such a scenario, gold could shine, although investors should remember that its price also initially fell in the aftermath of the bankruptcy of the Lehman Brothers (but the relative performance was better than in the case of equities). However, the current bull market may continue further - hence, investors who felt like buying gold as a hedge only against the imminent stock market crash may consider holding their horses.
Thank you.
If you enjoyed the above analysis and would you like to know more about the gold ETFs and their impact on gold price, we invite you to read the April Market Overview report. If you're interested in the detailed price analysis and price projections with targets, we invite you to sign up for our Gold & Silver Trading Alerts . If you're not ready to subscribe at this time, we invite you to sign up for our gold newsletter and stay up-to-date with our latest free articles. It's free and you can unsubscribe anytime.
Arkadiusz Sieron
Sunshine Profits‘ Market Overview Editor
Disclaimer
All essays, research and information found above represent analyses and opinions of Przemyslaw Radomski, CFA and Sunshine Profits' associates only. As such, it may prove wrong and be a subject to change without notice. Opinions and analyses were based on data available to authors of respective essays at the time of writing. Although the information provided above is based on careful research and sources that are believed to be accurate, Przemyslaw Radomski, CFA and his associates do not guarantee the accuracy or thoroughness of the data or information reported. The opinions published above are neither an offer nor a recommendation to purchase or sell any securities. Mr. Radomski is not a Registered Securities Advisor. By reading Przemyslaw Radomski's, CFA reports you fully agree that he will not be held responsible or liable for any decisions you make regarding any information provided in these reports. Investing, trading and speculation in any financial markets may involve high risk of loss. Przemyslaw Radomski, CFA, Sunshine Profits' employees and affiliates as well as members of their families may have a short or long position in any securities, including those mentioned in any of the reports or essays, and may make additional purchases and/or sales of those securities without notice.
Arkadiusz Sieron Archive |
© 2005-2022 http://www.MarketOracle.co.uk - The Market Oracle is a FREE Daily Financial Markets Analysis & Forecasting online publication.


